Discounted Cash Flow (DCF) Valuation

Business Scenario
You are working as a Investment Analyst preparing a valuation of Reliance Industries Limited (NSE: RELIANCE).
In this lab, you will use the Discounted Cash Flow (DCF) method to estimate the intrinsic value of Reliance Industries.
You will use actual financial information from the company's FY2025–26 Annual Report, recent market information, and Excel formulas to:

Pre-Lab Preparation
1. Project the company's future Free Cash Flow and calculate the Weighted Average Cost of Capital (WACC).
2. Calculate the company's Enterprise Value, Equity Value and Implied Share Price using DCF.
The purpose of this activity is to understand how investment analysts convert financial information into a company valuation
Topic : Valuation Techniques
1) Comparable company analysis
2) Precedent transaction analysis
3) Discounted cash flow (DCF)
4) Interpretation of valuation outputs
Lab File
Task 1: Project Free Cash Flow and Calculate Discount Rate (WACC)
Understand Financial Data Source
1
The financial information used in this lab is taken from:
Reliance Industries Limited – Integrated Annual Report 2025–26
The FY2025–26 consolidated cash-flow statement reports:
-
Net Cash Flow from Operating Activities: ₹1,92,113 crore
-
Expenditure for Property, Plant & Equipment, Spectrum and Other Intangible Assets: ₹1,22,916 crore
-
Closing Cash & Cash Equivalents: ₹1,45,977 crore
-
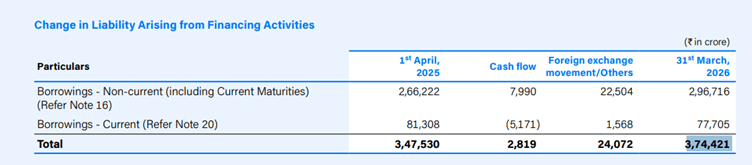
Total debt/borrowings: ₹3,74,421 crore.
The Annual Report also reports 13,53,24,72,634 equity shares, equivalent to approximately 1,353.25 crore shares.



Market Data
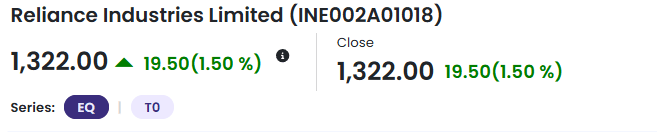
The Reliance share price used in this lab is:
₹1,322.00
This was the NSE closing price on 4 September 2026.
Beta
For this exercise, Beta is:
0.15
The latest available Beta reported for Reliance as of 6 September 2026 is approximately 1.01.
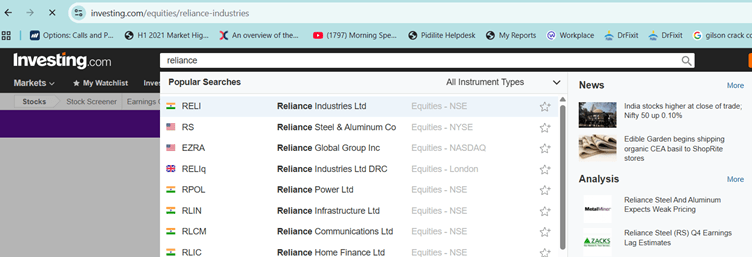
1. Go to https://www.investing.com
2. In the search bar, type Reliance Industries.
3. Select Reliance Industries Ltd.
4. Open the General section.
5. Look for Beta under the stock/valuation statistics.
6. Record the Beta value shown.
7. Use approximately 0.15 in the DCF calculation.
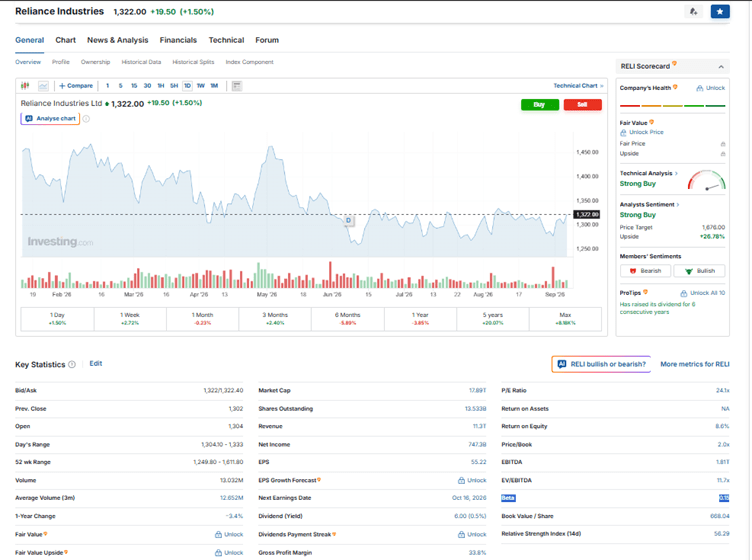
Important: Beta can differ between financial websites because different providers may use different calculation periods and methodologies. For this academic exercise, students should use 0.15 as the specified Beta assumption.
Risk-Free Rate
For the DCF exercise, the India 10-year government bond yield is taken at approximately:
6.96%
The 10-year Indian government bond yield was around 6.96% in early September 2026.
1. Go to Investing.com.
2. Select the India 10-Year Bond Yield page.
3. Check the latest Yield displayed.
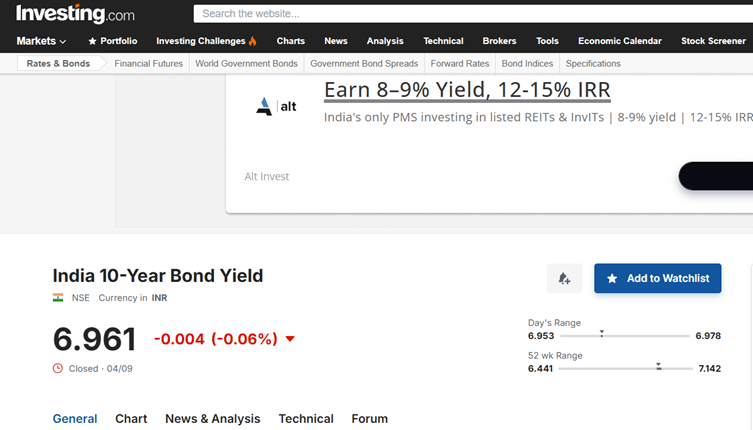
4. Record approximately 6.96% for this exercise.
5. Convert the percentage into decimal form when using the WACC formula:
6.96% = 0.0696
Calculate Base-Year Free Cash Flow
2
What is Free Cash Flow?
Free Cash Flow tells us approximately how much cash is left after the company has generated cash from its operations and spent money on capital expenditure.
Formula
Free Cash Flow = Operating Cash Flow − Capital Expenditure
Why do we use this formula?
A company generates cash from its business.
However, it must also spend money on things such as:
- Plants
- Equipment
- Technology
- Spectrum
- Other assets
Therefore, we subtract capital expenditure from operating cash flow.
For this lab, we will use FY2025–26 consolidated financial data from Reliance Industries' Annual Report.
| Financial Item | FY2025–26 |
|---|---|
| Cash Flow from Operating Activities | ₹1,92,113 crore |
| Capital Expenditure | ₹1,22,916 crore |
Formula
Free Cash Flow = Cash Flow from Operating Activities − Capital Expenditure
Therefore:
FCF = ₹1,92,113 crore − ₹1,22,916 crore
Base-Year FCF
₹69,197 crore
This ₹69,197 crore will be used as the Year 0 FCF in the DCF model.
Year 0 means the latest actual year that we are using as the starting point for our forecast
Enter DCF Inputs in Excel
3
Open a blank Excel workbook.
Rename the first worksheet:
DCF_Model
Enter the following information:
Select cell A1 in your Excel sheet, copy the block below, and press Ctrl + V (or Cmd + V) to paste it directly into cells A1:B8:
Plaintext
DCF Valuation – Reliance Industries
Current Share Price (₹) 1322.00
Shares Outstanding (Crores) 1353.25
Total Debt (₹ Crores) 374421
Cash & Cash Equivalents (₹ Crores) 145977
Base-Year FCF (₹ Crores) 69197
Beta 0.15
Cell Layout Reference
| Cell | Item (Column A) | Value (Column B) |
|---|---|---|
| A1 | DCF Valuation – Reliance Industries | (blank) |
Calculate WACC
4
WACC represents the average rate of return required by the company's investors and lenders.
Enter the following:
| A2 | (blank) | (blank) |
| A3 : B3 | Current Share Price (₹) | 1,322.00 |
| A4 : B4 | Shares Outstanding (Crores) | 1,353.25 |
| A5 : B5 | Total Debt (₹ Crores) | 3,74,421 |
| A6 : B6 | Cash & Cash Equivalents (₹ Crores) | 1,45,977 |
| A7 : B7 | Base-Year FCF (₹ Crores) | 69,197 |
| A8 : B8 | Beta | 0.15 |
| Cell | Item (Column A) | Value / Formula (Column B) |
| A10 | WACC Calculation | |
| A11 | Risk-Free Rate | 6.96% |
| A12 | Equity Risk Premium | 8.00% |
| A13 | Cost of Equity | =B11+(B8*B12) (8.16%) |
| A14 | After-Tax Cost of Debt | 6.00% |
| A15 | Market Capitalization | =B3*B4 (17,88,996.50) |
| A16 | Total Capital | =B15+B5 (21,63,417.50) |
| A17 | Equity Weight | =B15/B16 (82.69%) |
| A18 | Debt Weight | =B5/B16 (17.31%) |
| A19 | Calculated WACC | =(B17*B13)+(B18*B14) (7.79%) |
A : Calculate Cost of Equity
What is Cost of Equity?
Cost of Equity tells us the return that shareholders expect from investing in Reliance.
We use the CAPM formula.
Formula:
Cost of Equity = Risk-Free Rate + (Beta × Equity Risk Premium)
Why do we use this formula?
Why do we use this formula?
An investor can earn a relatively safe return by investing in government securities.
If the investor buys a risky company's shares instead, the investor expects an additional return for taking that risk.
Beta measures how sensitive the stock is to market movements.
Excel formula:
=B11+(B8*B12)
Using the given assumptions:
= 6.96% + (0.15 × 8.00%)
= 6.96% + 1.20%
Cost of Equity = 8.16%
B : Calculate Market Capitalization
What is Market Capitalization?
Market Capitalization is the total market value of the company's equity.
In simple words:
“What is the stock market currently valuing all the company's shares at?”
Use:
Market Capitalization = Share Price × Shares Outstanding
Excel:
=B3*B4
Therefore:
₹1,322 × 1,353.25 crore
Market Capitalization = ₹17,88,996.50 crore
C : Calculate Total Capital
Why do we calculate Total Capital?
A company is financed by:
1. Equity
2. Debt
We need to know how much of the company's financing comes from each source.
Use:
Total Capital = Market Capitalization + Total Debt
Excel:
=B15+B5
Therefore:
₹17,88,996.50 + ₹3,74,421
Total Capital = ₹21,63,417.50 crore
D : Calculate Capital Weights
Why do we calculate Equity Weight?
WACC combines the cost of:
-
Equity
-
Debt
Therefore, we need to know the proportion of each.
Equity Weight
Excel:
=B15/B16
Expected result:
82.69%
This means approximately 82.69% of Reliance's capital is represented by equity in this simplified model.
Debt Weight
Excel:
=B5/B16
Expected result:
17.31%
Check
Equity Weight + Debt Weight
= 82.69% + 17.31%
= 100%
E : Calculate WACC
What is WACC?
WACC stands for:
Weighted Average Cost of Capital
Think of WACC as the company's required return.
Use:
WACC = (Equity Weight × Cost of Equity) + (Debt Weight × After-Tax Cost of Debt)
Why do we use this formula?
Reliance gets financing from both:
-
Shareholders
-
Lenders
Therefore, we calculate the average cost of both sources based on their weights.
Excel:
=(B17*B13)+(B18*B14)
WACC = (82.69% × 8.16%) + (17.31% × 6.00%)
Calculated WACC ≈ 7.79%
This percentage will be used as the discount rate in the DCF valuation.
Project 5-Year Free Cash Flow
5
Now we need to estimate how much cash Reliance could generate in the future.
We will forecast FCF for:
- Year 1
- Year 2
- Year 3
- Year 4
- Year 5
For this exercise, use:
| Assumption | Value |
| Forecast Period | 5 years |
| Year 1 FCF Growth | 25% |
| Year 2 FCF Growth | 20% |
| Year 3 FCF Growth | 15% |
| Year 4 FCF Growth | 12% |
| Year 5 FCF Growth | 10% |
| Terminal Growth Rate | 5.0% |
Create the FCF Forecast Table
Cell Layout Reference
| Cell / Row | Column A | Year 0 (Col B) | Year 1 (Col C) | Year 2 (Col D) | Year 3 (Col E) | Year 4 (Col F) | Year 5 (Col G) |
| Row 21 | FCF Projections | ||||||
| Row 22 | Year | 0 | 1 | 2 | 3 | 4 | 5 |
| Row 23 | YoY Growth Rate | (blank) | 25.00% | 20.00% | 15.00% | 12.00% | 10.00% |
| Row 24 | Projected Free Cash Flow | =B7 | =B24*(1+C23) | =C24*(1+D23) | =D24*(1+E23) | =E24*(1+F23) | =F24*(1+G23) |
Projected Free Cash Flow (₹ Crore)
| Year 0 | Year 1 | Year 2 | Year 3 | Year 4 | Year 5 |
| 69,197.00 | 86,496.25 | 103,795.50 | 119,364.82 | 133,688.60 | 147,057.46 |
(For presentation, students may round these values to the nearest crore).
Task 2: Calculate Company Valuation Using DCF
Now we have estimated Reliance's future cash flows.
But there is one important problem:
₹1 received five years from now is not worth the same as ₹1 today.
Therefore, we need to convert future cash flows into today's value.
This is called:
Present Value (PV)
Calculate the Discount Factor
1
What is a Discount Factor?
The discount factor converts future money into today's value.
The farther into the future the cash flow is, the more we discount it
Formula
Discount Factor = 1 ÷ (1 + WACC)^Year
Why do we use WACC?
WACC represents the required return used to discount the company's future cash flows.
Calculate Present Value of FCF
Now we convert each future FCF into today's value.
Formula
PV of FCF = Projected FCF × Discount Factor
Why?
The discount factor tells us how much today's value corresponds to each rupee of future cash flow.
Enter:
| Cell / Row | Column A | Column B | Year 1 (Col C) | Year 2 (Col D) | Year 3 (Col E) | Year 4 (Col F) | Year 5 (Col G) |
| 26 | DCF Valuation & Present Value | ||||||
| 27 | Terminal Growth Rate | 5.00% | |||||
| 28 | Discount Factor | (blank) | =1/((1+$B$19)^C22) | =1/((1+$B$19)^D22) | =1/((1+$B$19)^E22) | =1/((1+$B$19)^F22) | =1/((1+$B$19)^G22) |
| 29 | PV of FCF | (blank) | =C24*C28 | =D24*D28 | =E24*E28 | =F24*F28 | =G24*G28 |
Enter Terminal Growth Rate
After Year 5, we assume Reliance will continue growing at a stable long-term rate.
For this exercise:
Terminal Growth Rate = 5%
Enter:
| Cell | Item | Value |
| A27 | Terminal Growth Rate | 5% |
Calculate Terminal Value
2
What is Terminal Value?
We cannot forecast Reliance year by year forever.
Therefore, after Year 5, we estimate the value of all future cash flows together.
This is called:
Terminal Value (TV)
Formula
Terminal Value = Year 5 FCF × (1 + Terminal Growth Rate) ÷ (WACC − Terminal Growth Rate)
Why do we use this formula?
We assume that after Year 5:
Reliance will continue generating cash and growing at a stable rate of 5%.
Important
The WACC must be greater than the terminal growth rate.
Here:
WACC = 7.79%
Terminal Growth = 5.00%
Enter:
| Cell | Item | Formula / Result |
| A31 | Terminal Value (TV) | (In Cell G31) =(G24*(1+$B$27))/($B$19-$B$27) |
| A32 | PV of Terminal Value | (In Cell G32) =G31*G28 |
Results:
-
Year 5 FCF: ₹1,47,057.46 crore (Cell G24)
-
Terminal Growth Rate: 5.00% (Cell B27)
-
WACC: 7.79% (Cell B19)
-
Terminal Value: ≈ ₹55,42,027.65 crore
-
Present Value of Terminal Value: ≈ ₹38,09,372.81 crore
Results:
-
Year 5 FCF: ₹1,47,057.46 crore (Cell G24)
-
Terminal Growth Rate: 5.00% (Cell B27)
-
WACC: 7.79% (Cell B19)
-
Terminal Value: ≈ ₹55,42,027.65 crore
-
Present Value of Terminal Value: ≈ ₹38,09,372.81 crore
Calculate Enterprise Value
3
What is Enterprise Value?
Enterprise Value represents the estimated value of the company's operations before considering the company's cash and debt.
Formula
Enterprise Value = PV of Forecast FCFs + PV of Terminal Value
| Cell | Item | Formula / Result |
| A35 | Sum of PV of FCFs | =SUM(C29:G29) (₹4,65,038.79 crore) |
| A36 | PV of Terminal Value | =G32 (₹38,09,372.81 crore) |
| A37 | Enterprise Value (EV) | =B35+B36 (₹42,74,411.60 crore) |
Calculate Net Debt
4
What is Net Debt?
Net Debt shows how much debt remains after considering the company's available cash.
Formula
Net Debt = Total Debt − Cash
Why?
If Reliance has ₹3,74,421 crore of debt but ₹1,45,977 crore of cash, the cash can be used to reduce the effective debt burden.
| Cell | Item | Formula / Result |
| A38 | Less: Net Debt | =B5-B6 (₹2,28,444.00 crore) |
Calculate Implied Equity Value
5
Enterprise Value belongs to both debt holders and equity holders.
To estimate the value belonging to shareholders, we subtract net debt
Formula
Equity Value = Enterprise Value − Net Debt
| Cell | Item | Formula / Result |
| A39 | Implied Equity Value | =B37-B38 (₹40,45,967.60 crore) |
Calculate Implied Share Price
6
Now we want to know:
What is the estimated value of one Reliance share?
Formula
Implied Share Price = Equity Value ÷ Shares Outstanding
| Cell | Item | Formula / Result |
| A40 | Implied Share Price (₹) | =B39/B4 (₹2,989.82) |
Compare Market Price with DCF Value
7
The current market price is:
₹1,322
The DCF estimated value is approximately:
₹2,990
Now calculate the potential upside.
Formula
Upside / (Downside) = (DCF Value − Current Price) ÷ Current Price
| Cell | Item | Formula / Result |
| A41 | Valuation Premium / (Discount) | =(B40-B3)/B3 (+126.16%) |
Our DCF model estimates:
Current Market Price = ₹1,322
DCF Implied Value = approximately ₹2,990
Therefore, the model indicates an implied upside of approximately:
What does this mean?
Reliance appears undervalued relative to its current market price.
However, this does not mean that the share will definitely reach ₹2,990.
The DCF value depends heavily on assumptions such as:
-
FCF growth
-
WACC
-
Beta
-
Risk-free rate
-
Equity risk premium
-
Terminal growth rate
-
Capital expenditure
-
Debt and cash
A small change in WACC or terminal growth can produce a large change in the DCF value