


Content ITV PRO
This is Itvedant Content department
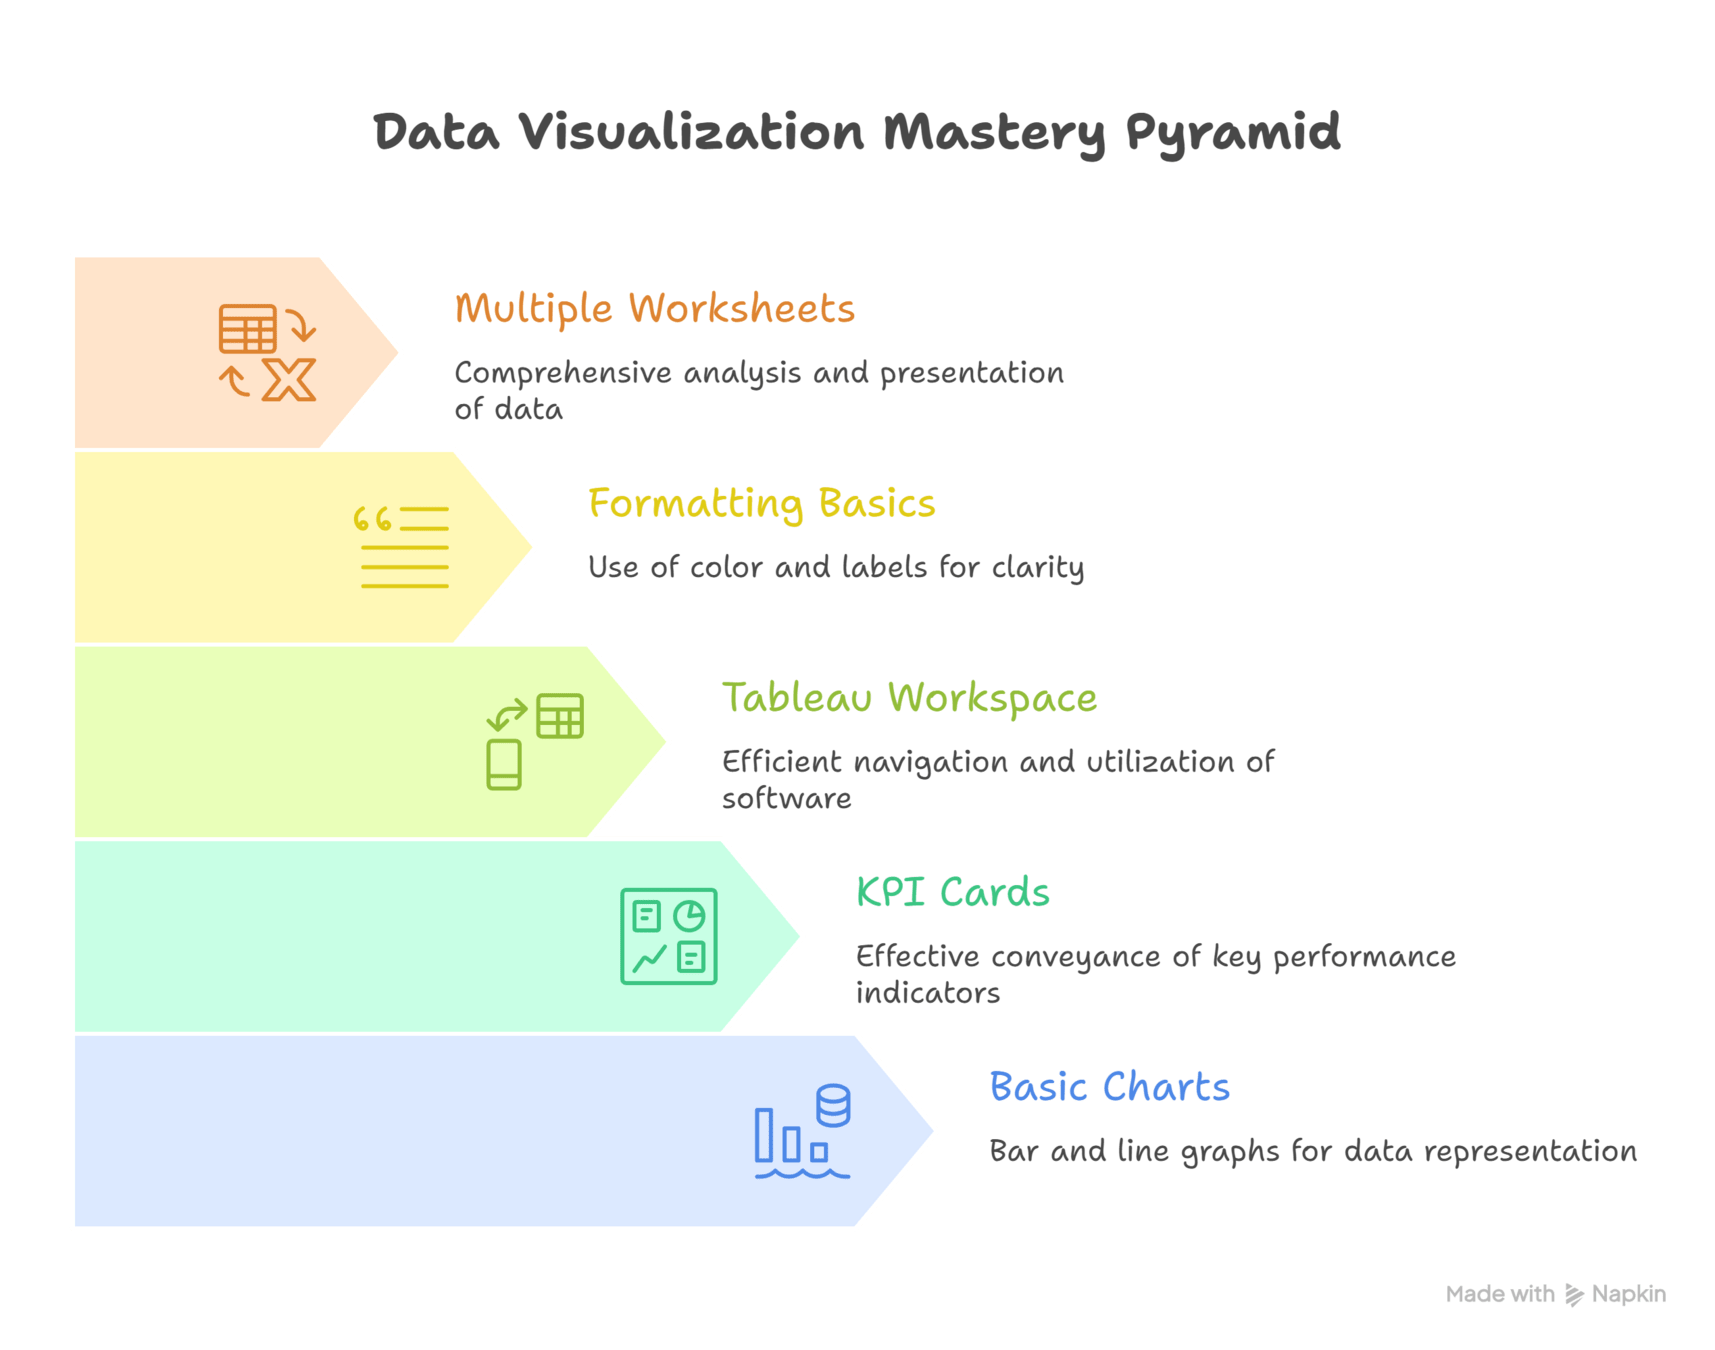
Learning Outcome
4
Prepare data in forms required for analysis and visualization
3
Rename, combine, reshape, and aggregate datasets effectively
2
Understand how structure and organization affect analytical outcomes
1
Explain what “polishing data” means in the context of data analysis
Already established concepts include:
Pandas DataFrames and Series
Data inspection (info(), describe())
Handling missing values
Grouping, aggregation, and pivot tables
Indexing and data types
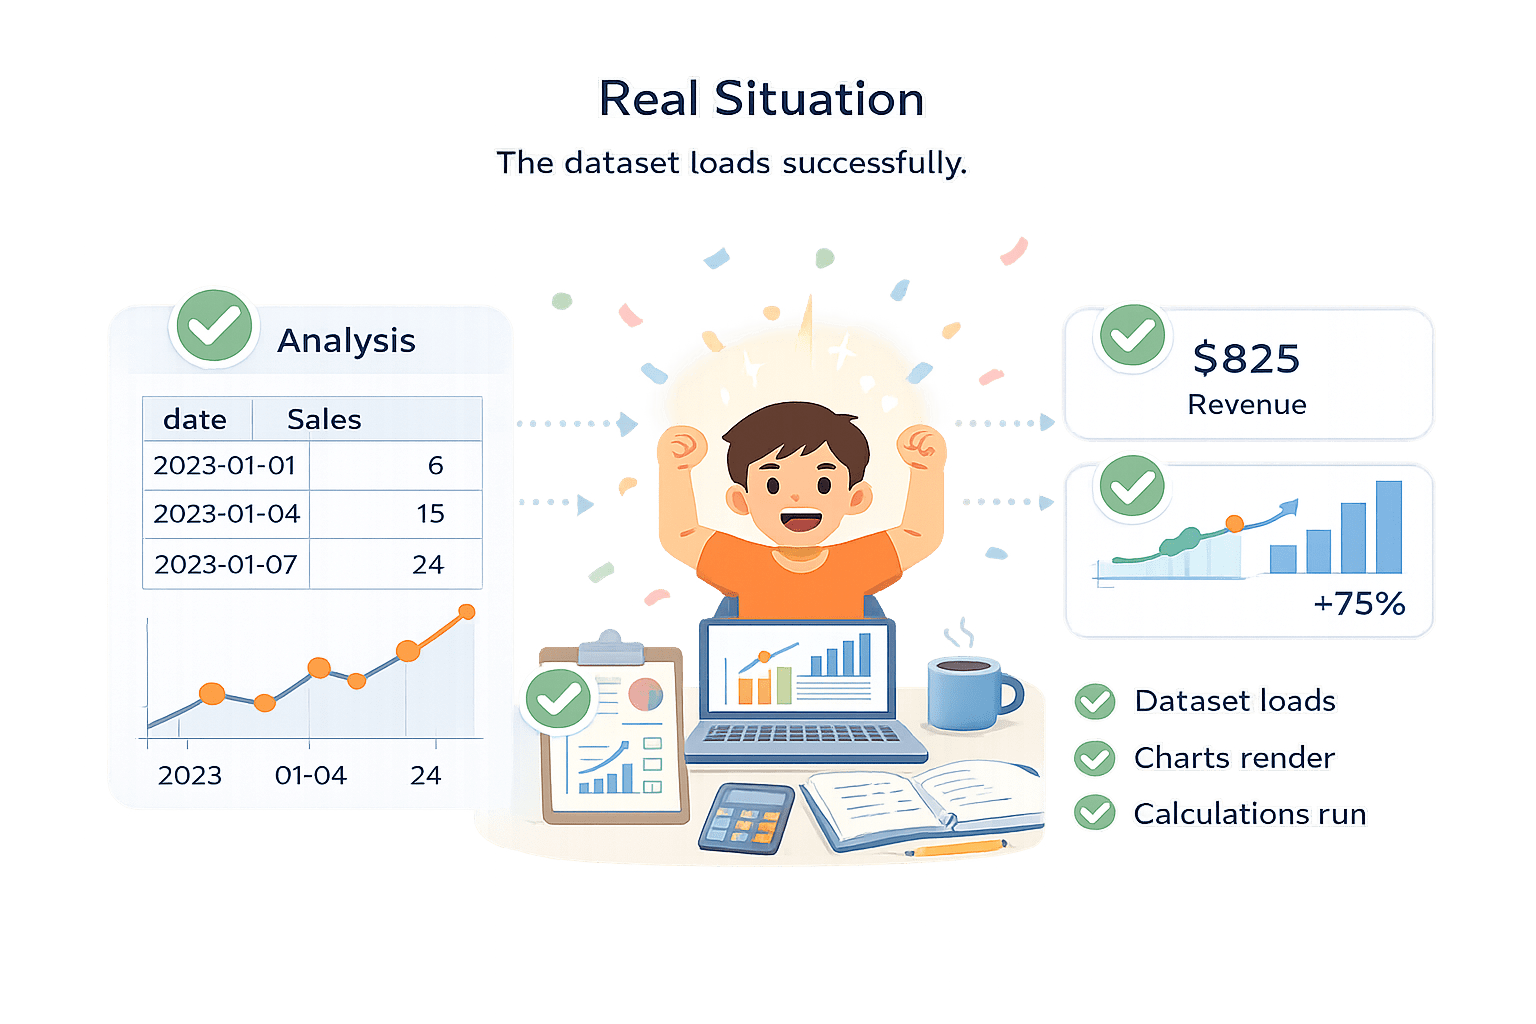
The dataset loads successfully.
Charts render.
Numbers calculate.
Imagine you load a dataset
Limitation / confusion
Results feel inconsistent.
Trends seem misleading.
Decisions feel uncertain.
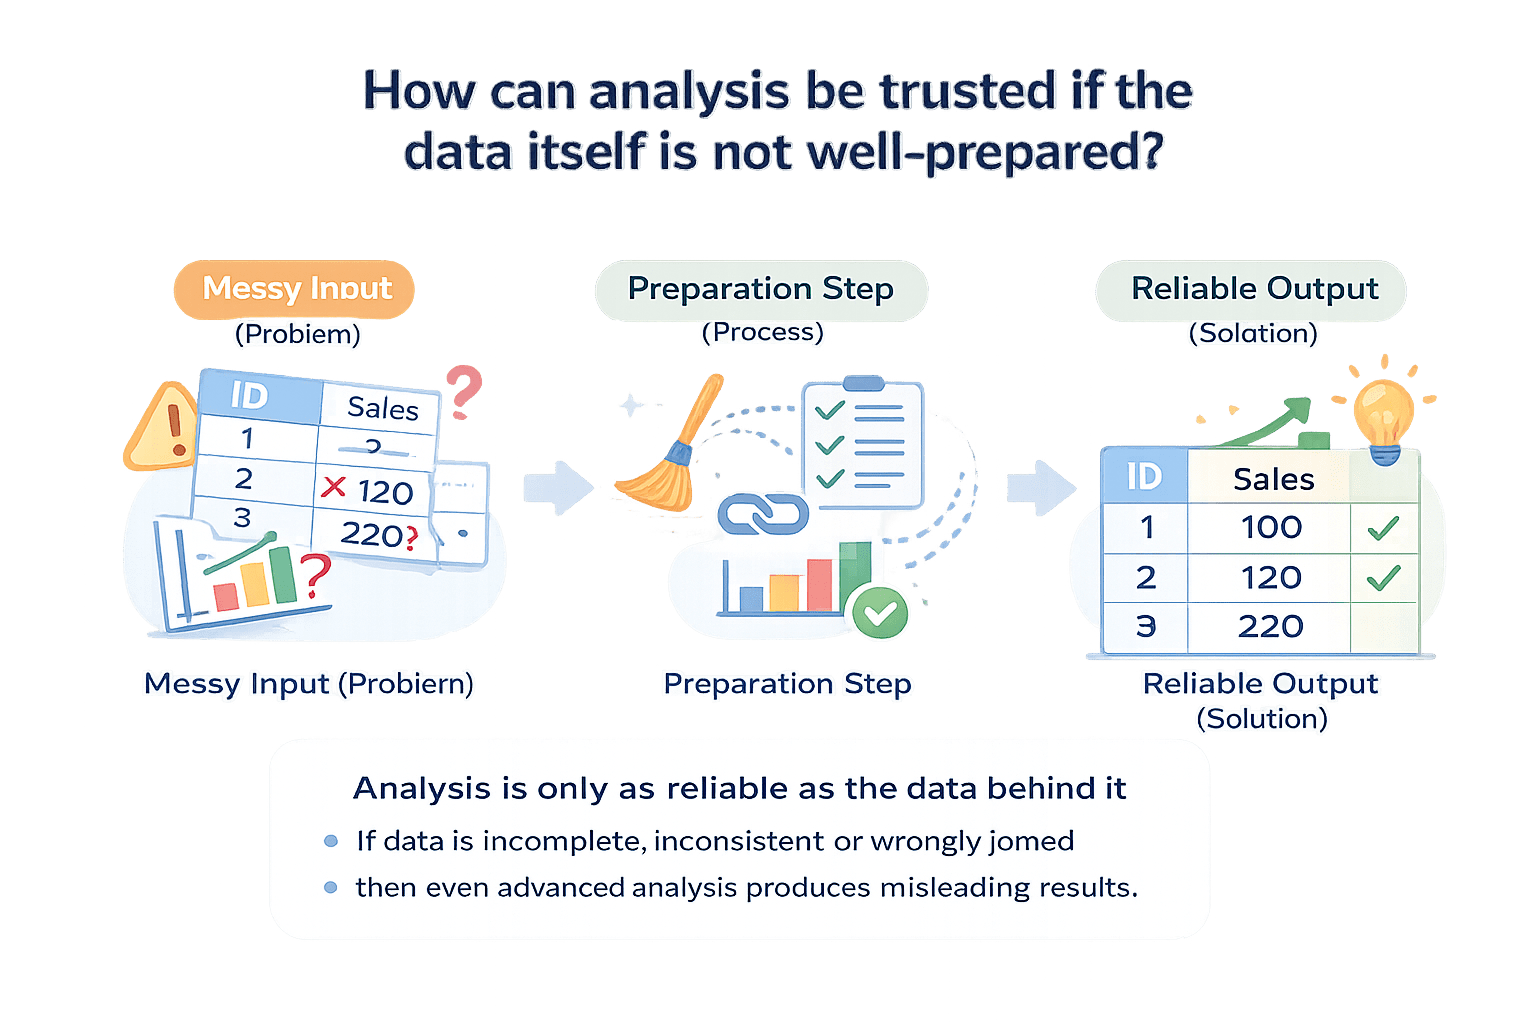
How can analysis be trusted of the data itself is not well-prepared?
By refining structure and intent before analysis.
Polished data leads to reliable insight.
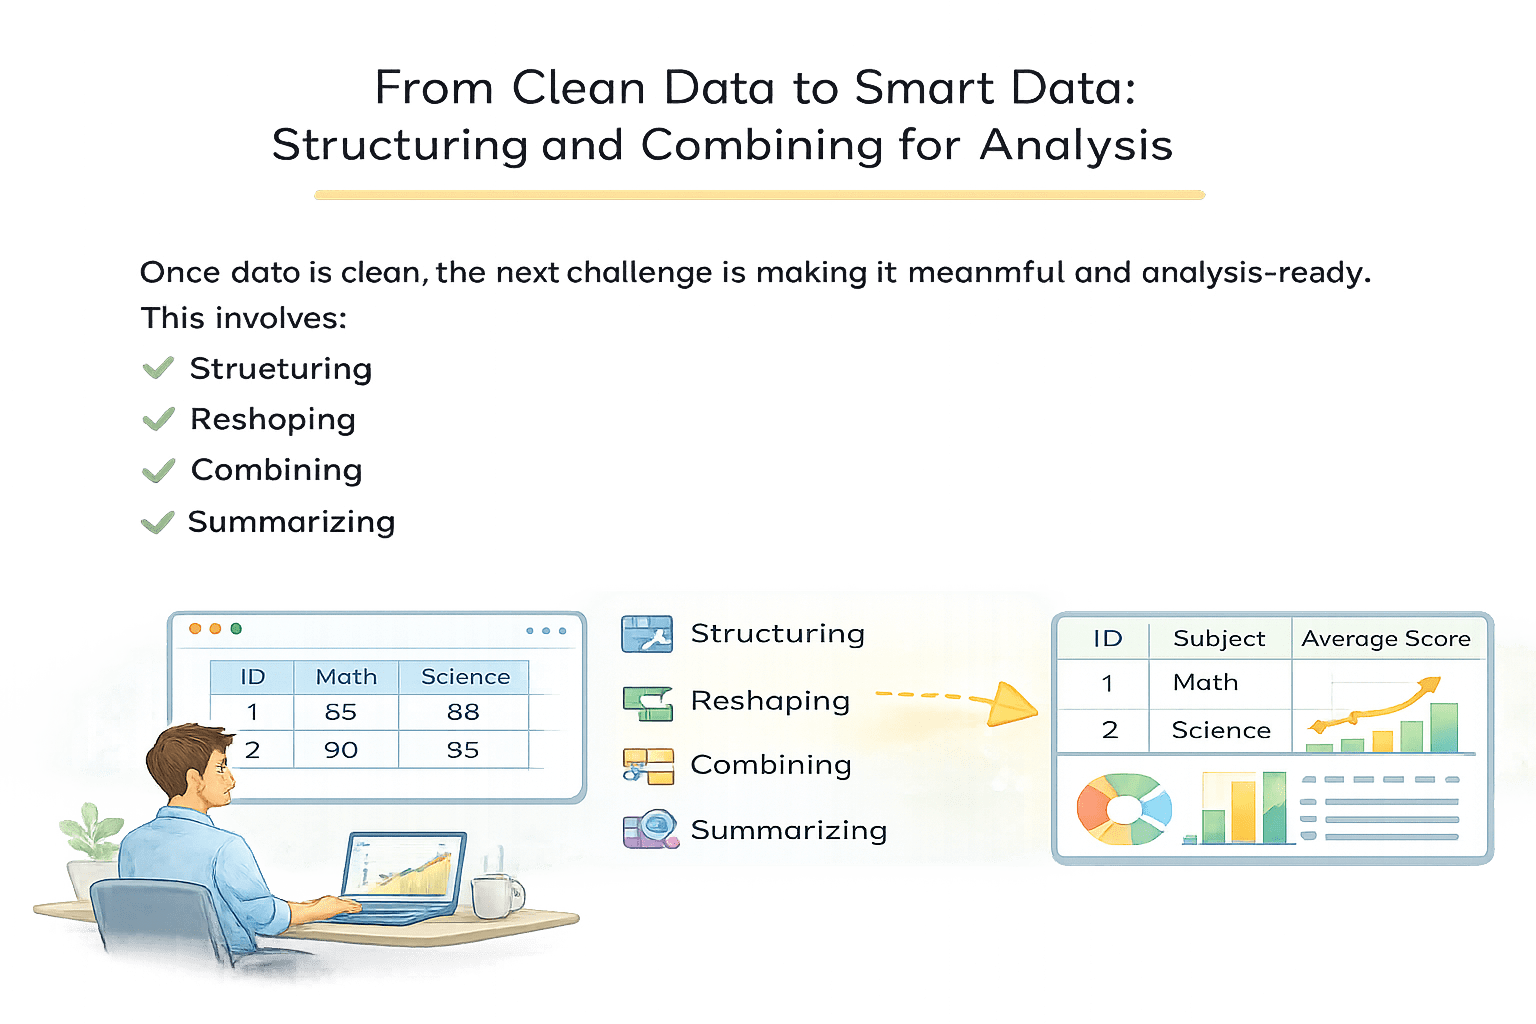
Once data is clean, the next challenge is making it meaningful and analysis-ready.
This involves structuring, combining, reshaping, and summarizing data appropriately.
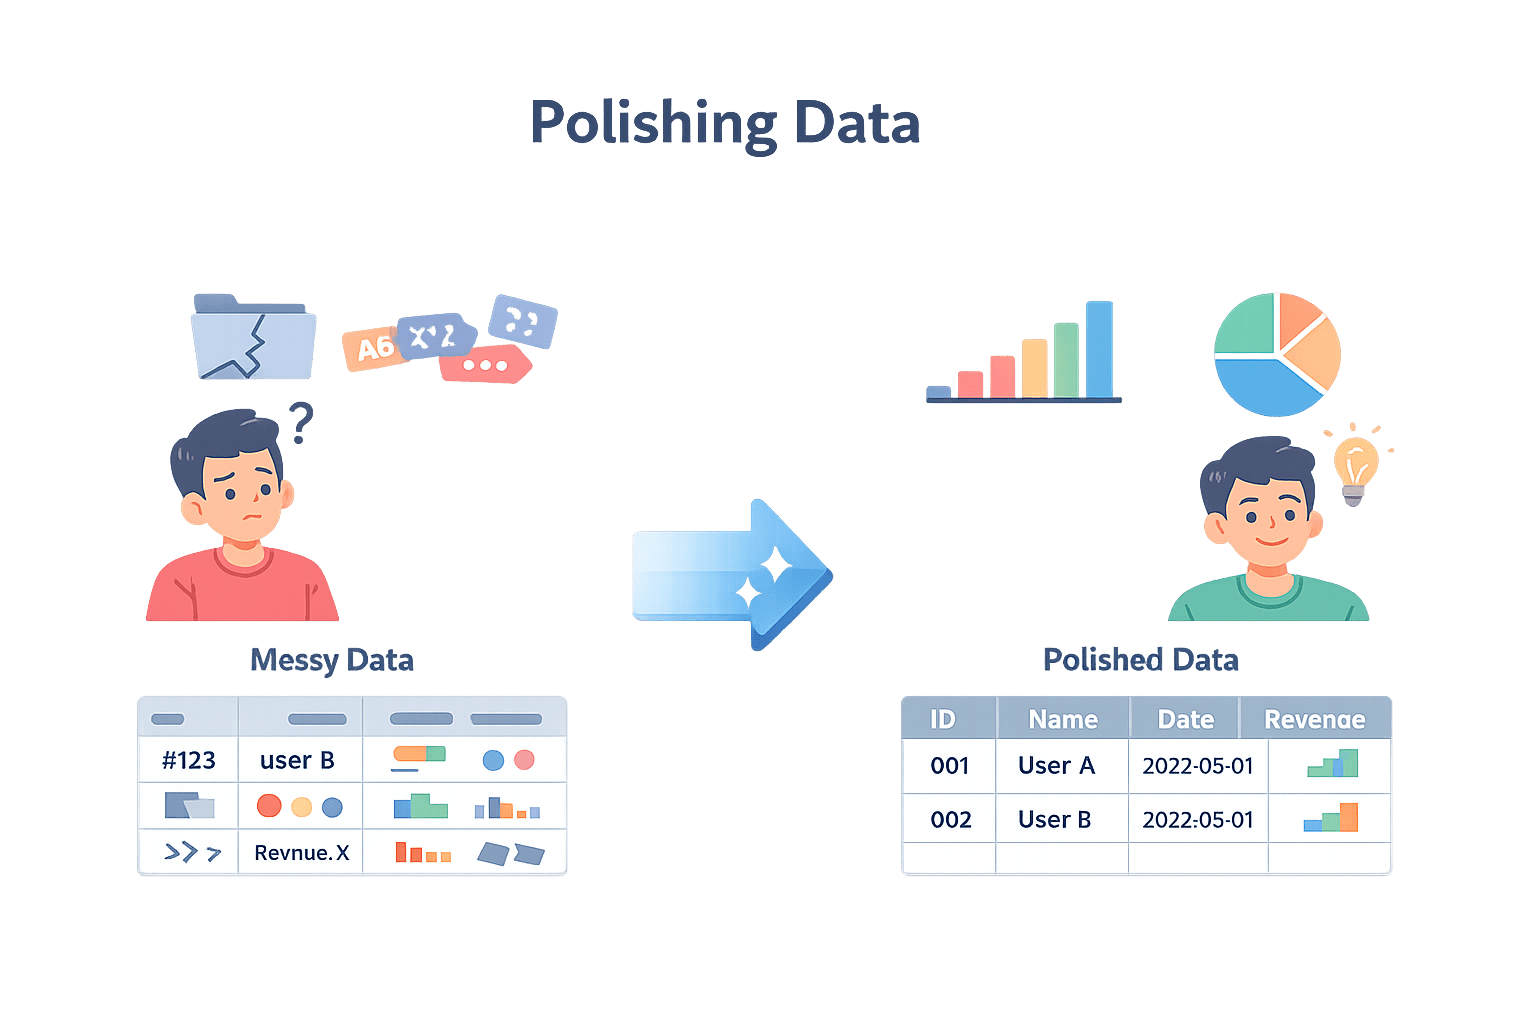
Polishing Data
Polishing data is the process of transforming already-clean data into well-structured, clearly labeled, and analytically purposeful formats that support accurate analysis and visualization.
Why it matters
Even clean data can be fragmented, poorly named, or structurally inconvenient for analysis. Polishing resolves these issues.
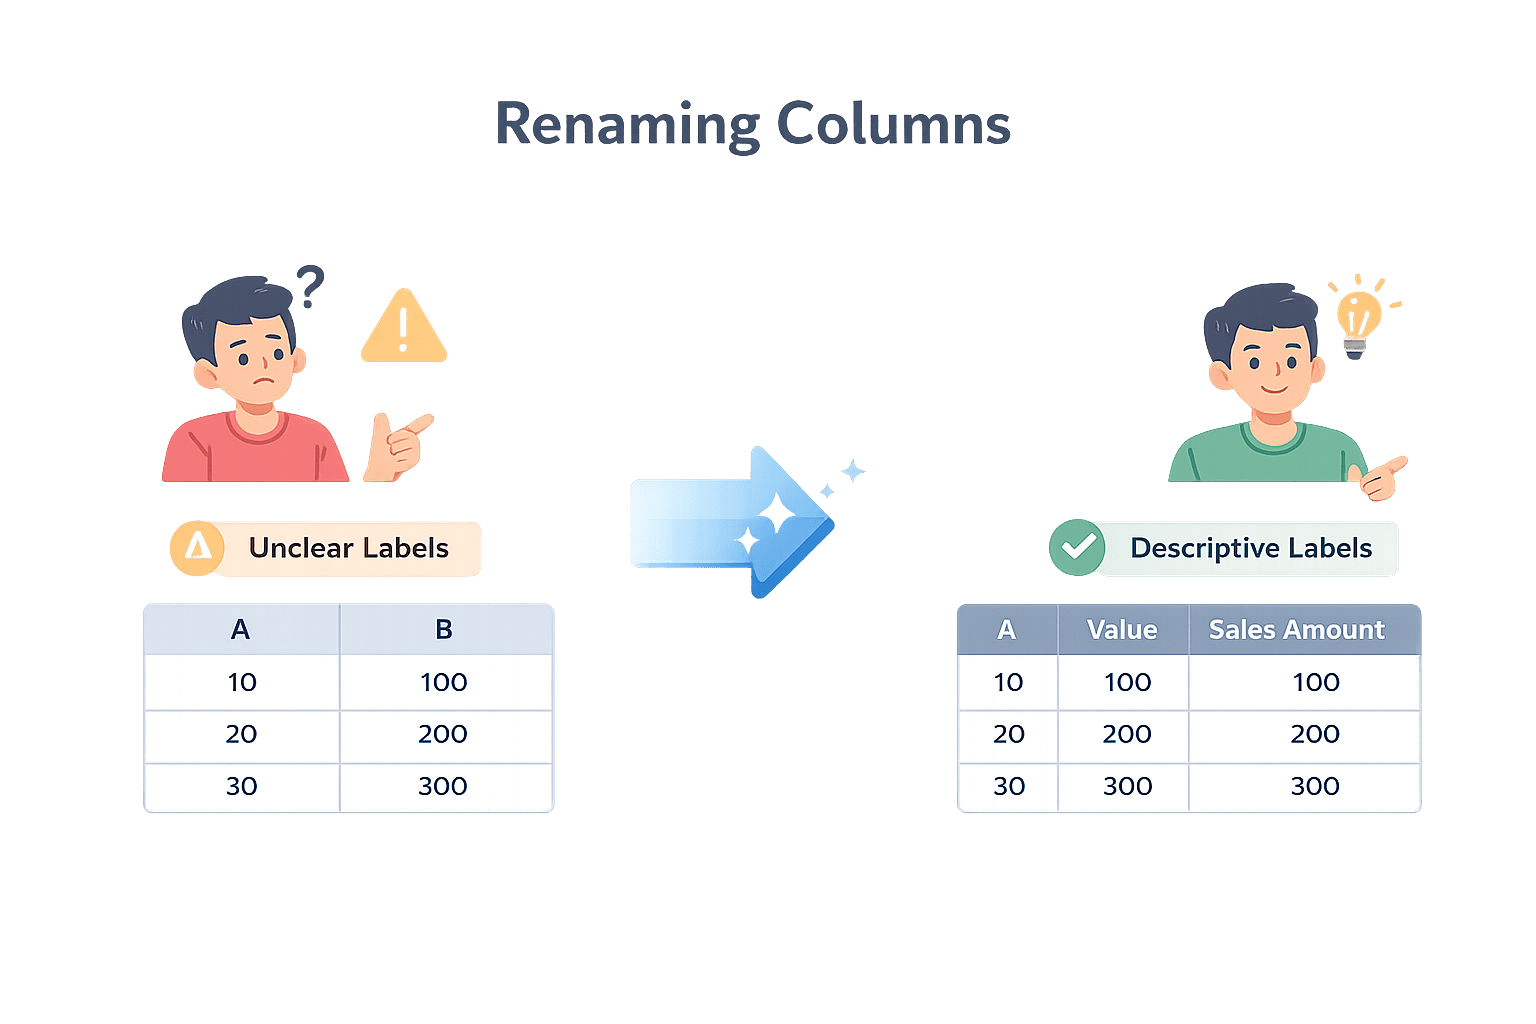
Renaming Columns
Renaming columns is the process of replacing unclear, abbreviated, or system-generated column names with meaningful and descriptive labels.
import pandas as pd

df = pd.DataFrame({
    "A": [10, 20, 30],
    "B": [100, 200, 300]
})
Sample Dataset
df.rename(columns={"A": "Quantity", "B": "Revenue"}, inplace=True)Clear column name reduce
ambiguity,improve readability
and makes analysis clear
| A | B |
|---|---|
| 10 | 100 |
| 20 | 200 |
| 30 | 300 |
| Quantity | Revenue |
|---|---|
| 10 | 100 |
| 20 | 200 |
| 30 | 300 |
Before
After
Output
| 0 |
| 1 |
| 2 |
Clear column names reduce ambiguity, improve readability, and make analytical code easier to interpret and maintain.
Why this is polishing
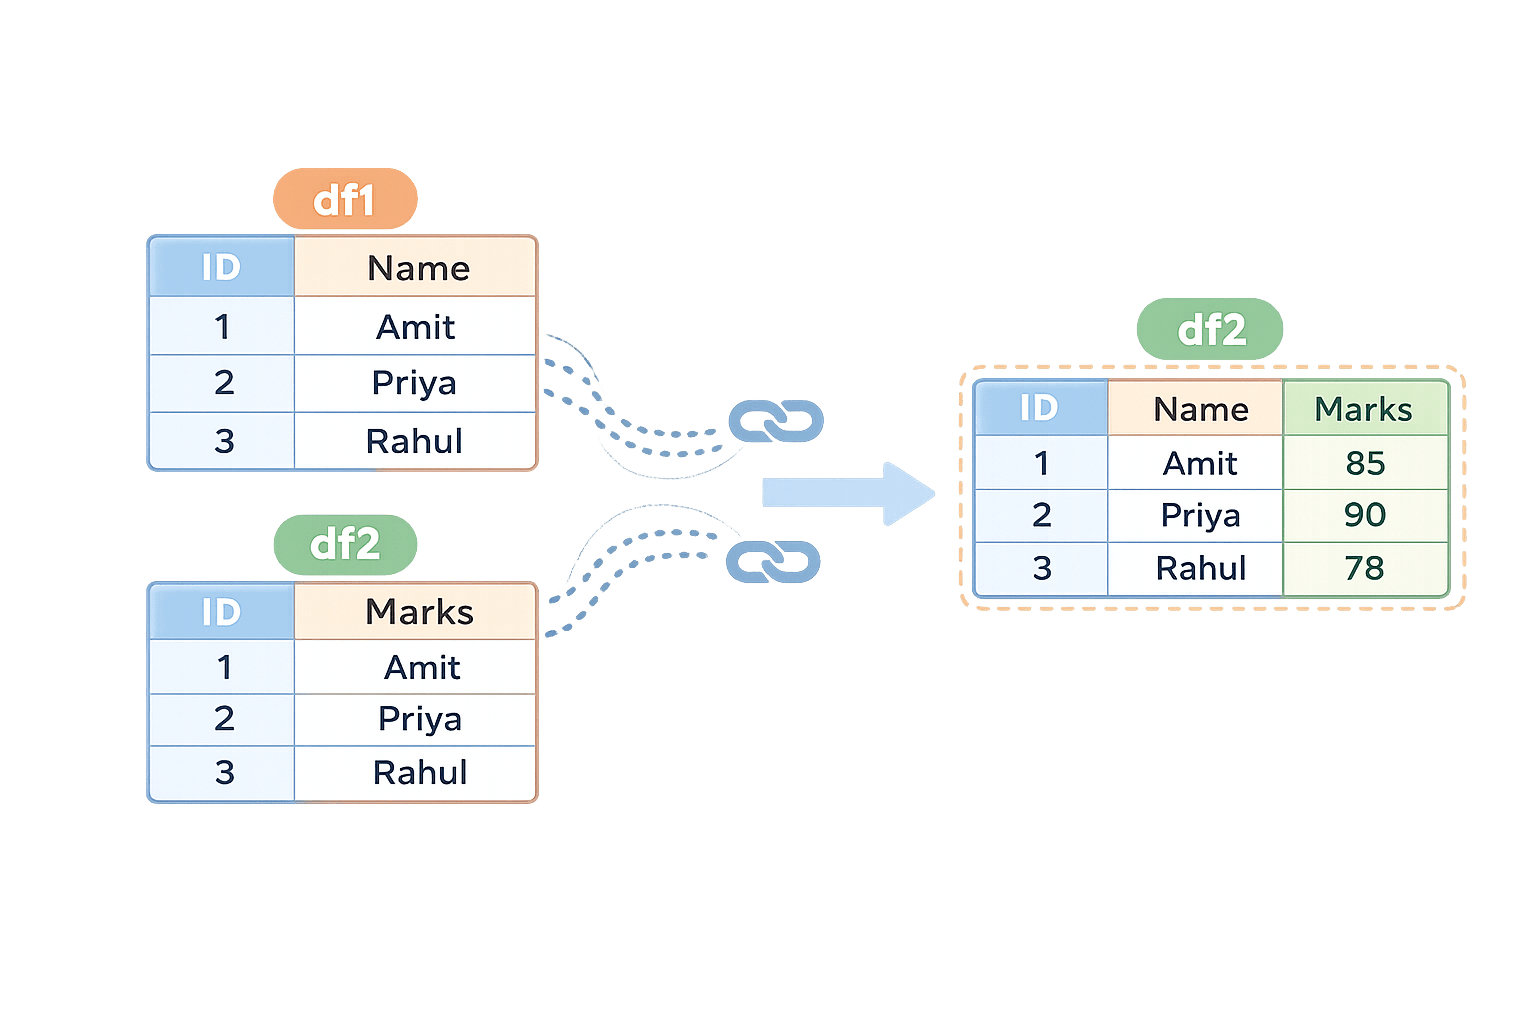
Joining and Merging Datasets
Joining (or merging) is the process of combining rows from two or more DataFrames based on a shared key to reconstruct complete records.
df1 = pd.DataFrame({
    "ID": [1, 2, 3],
    "Name": ["Amit", "Priya", "Rahul"]
})

df2 = pd.DataFrame({
    "ID": [1, 2, 3],
    "Marks": [85, 90, 78]
})
Sample Datasets
merged_df = pd.merge(df1, df2, on="ID")
merged_df
Joining integrates related information, enabling holistic analysis rather than fragmented insights.
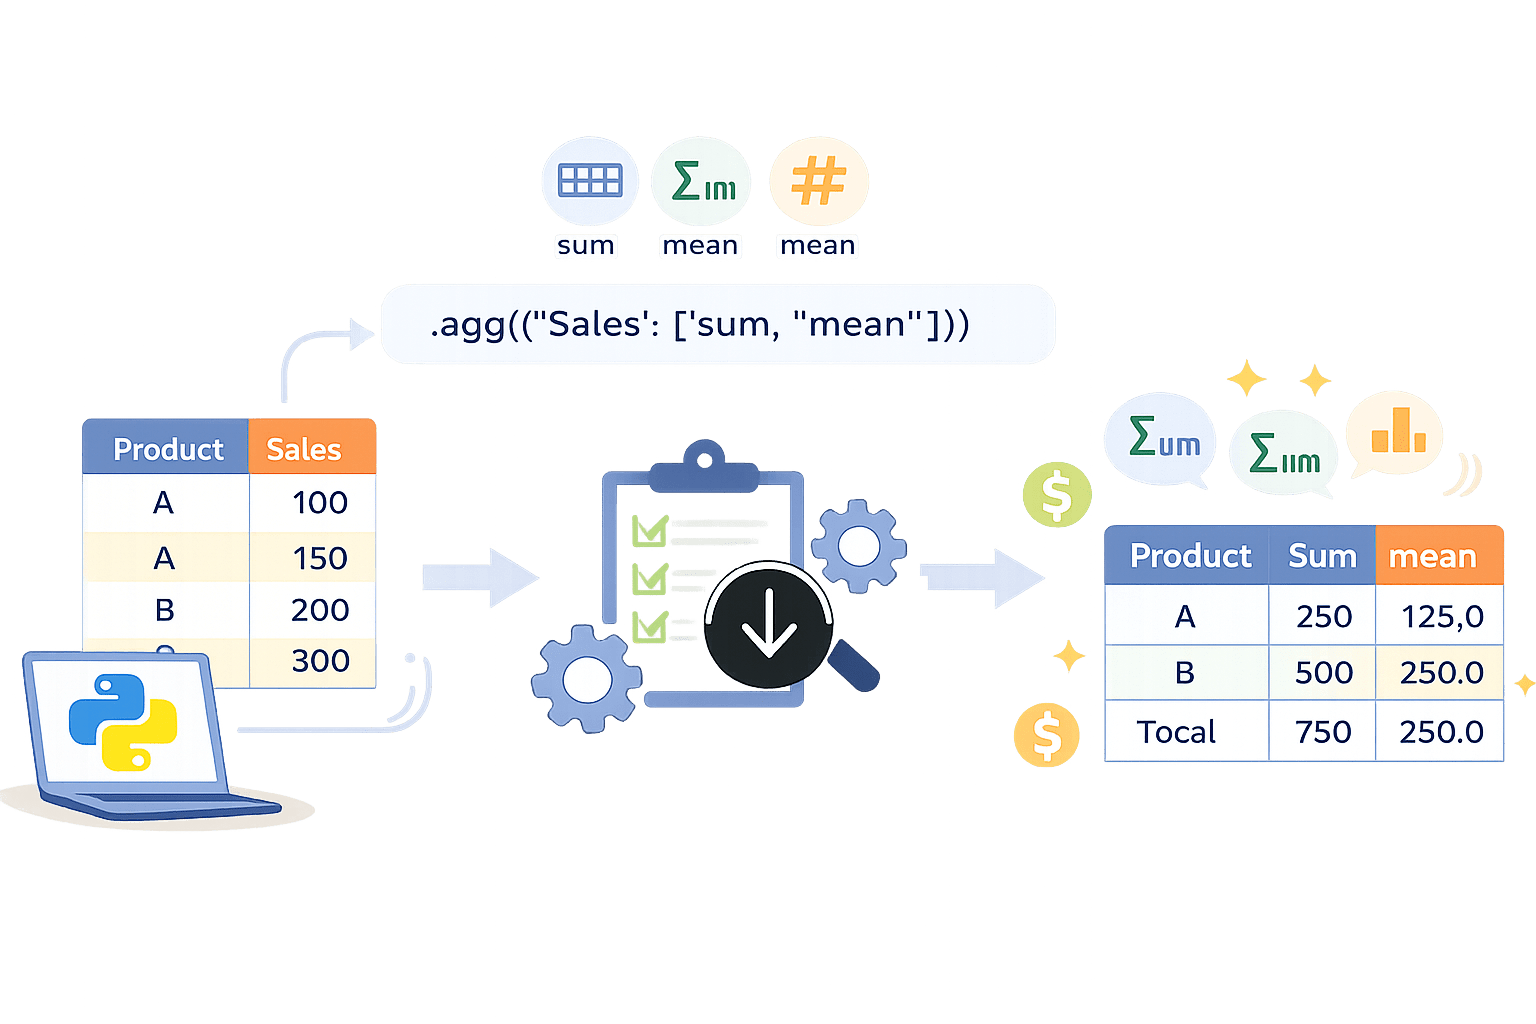
Aggregating Data Using agg()
Aggregation is the process of summarizing detailed data into higher-level metrics such as totals, averages, or counts.
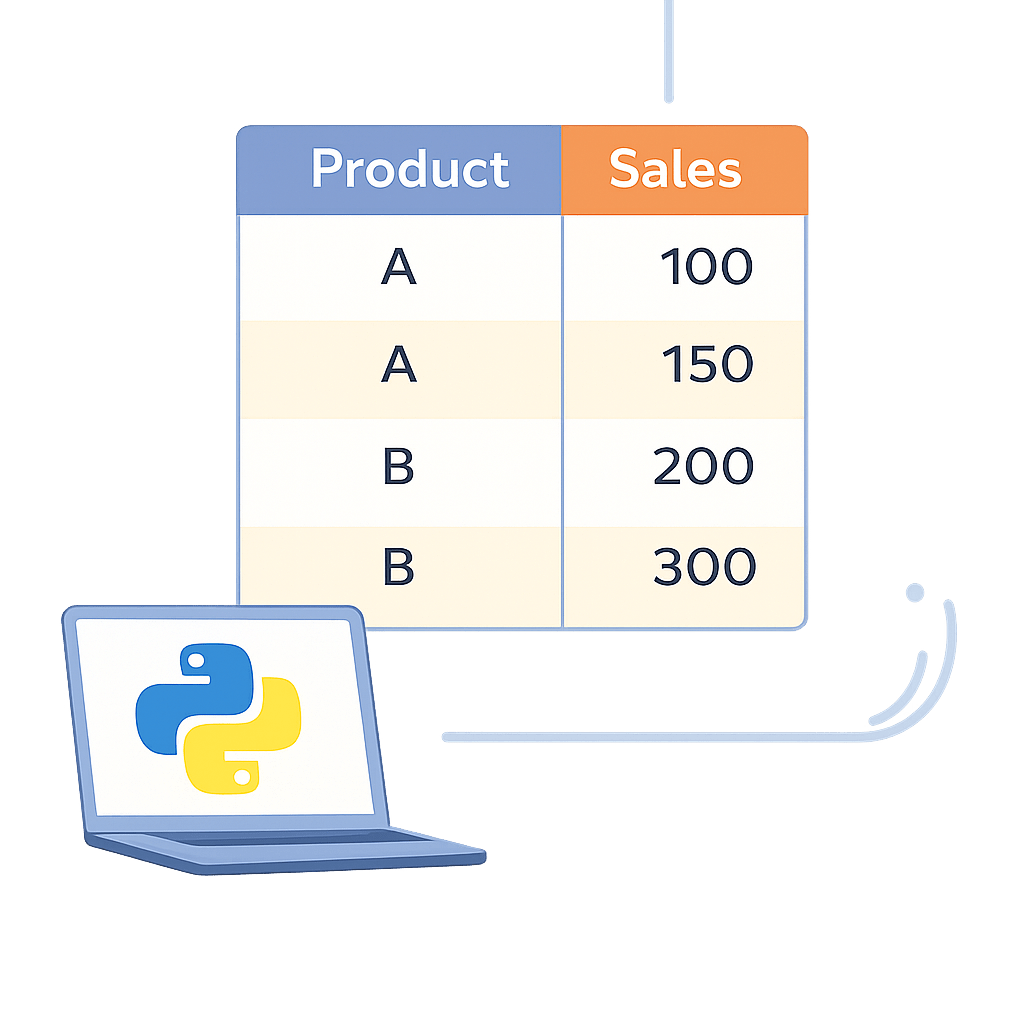
Sample Dataset
df = pd.DataFrame({
    "Product": ["A", "A", "B", "B"],
    "Sales": [100, 150, 200, 300]
})
result = df.groupby("Product").agg({"Sales": ["sum", "mean"]})Multiple metrics are presented together, improving clarity and reducing fragmented analysis.
Reshaping Data Using melt()
Data reshaping is the process of changing the structural layout of data without changing its meaning.
melt() converts wide-format data into long-format data.
| ID | Math | Science |
|---|---|---|
| 1 | 85 | 88 |
| 2 | 90 | 95 |
Sample Dataset
df = pd.DataFrame({
    "ID": [1, 2],
    "Math": [85, 90],
    "Science": [88, 95]
})
melted_df = pd.melt(
    df,
    id_vars=["ID"],
    value_vars=["Math", "Science"],
    var_name="Subject",
    value_name="Score"
)
melted_df
Code
| ID | Subject | Score |
|---|---|---|
| 1 | Math | 85 |
| 2 | Math | 90 |
| 1 | Science | 88 |
| 2 | Science | 95 |
Long-format data is flexible, scalable, and directly compatible with analysis and visualization workflows.
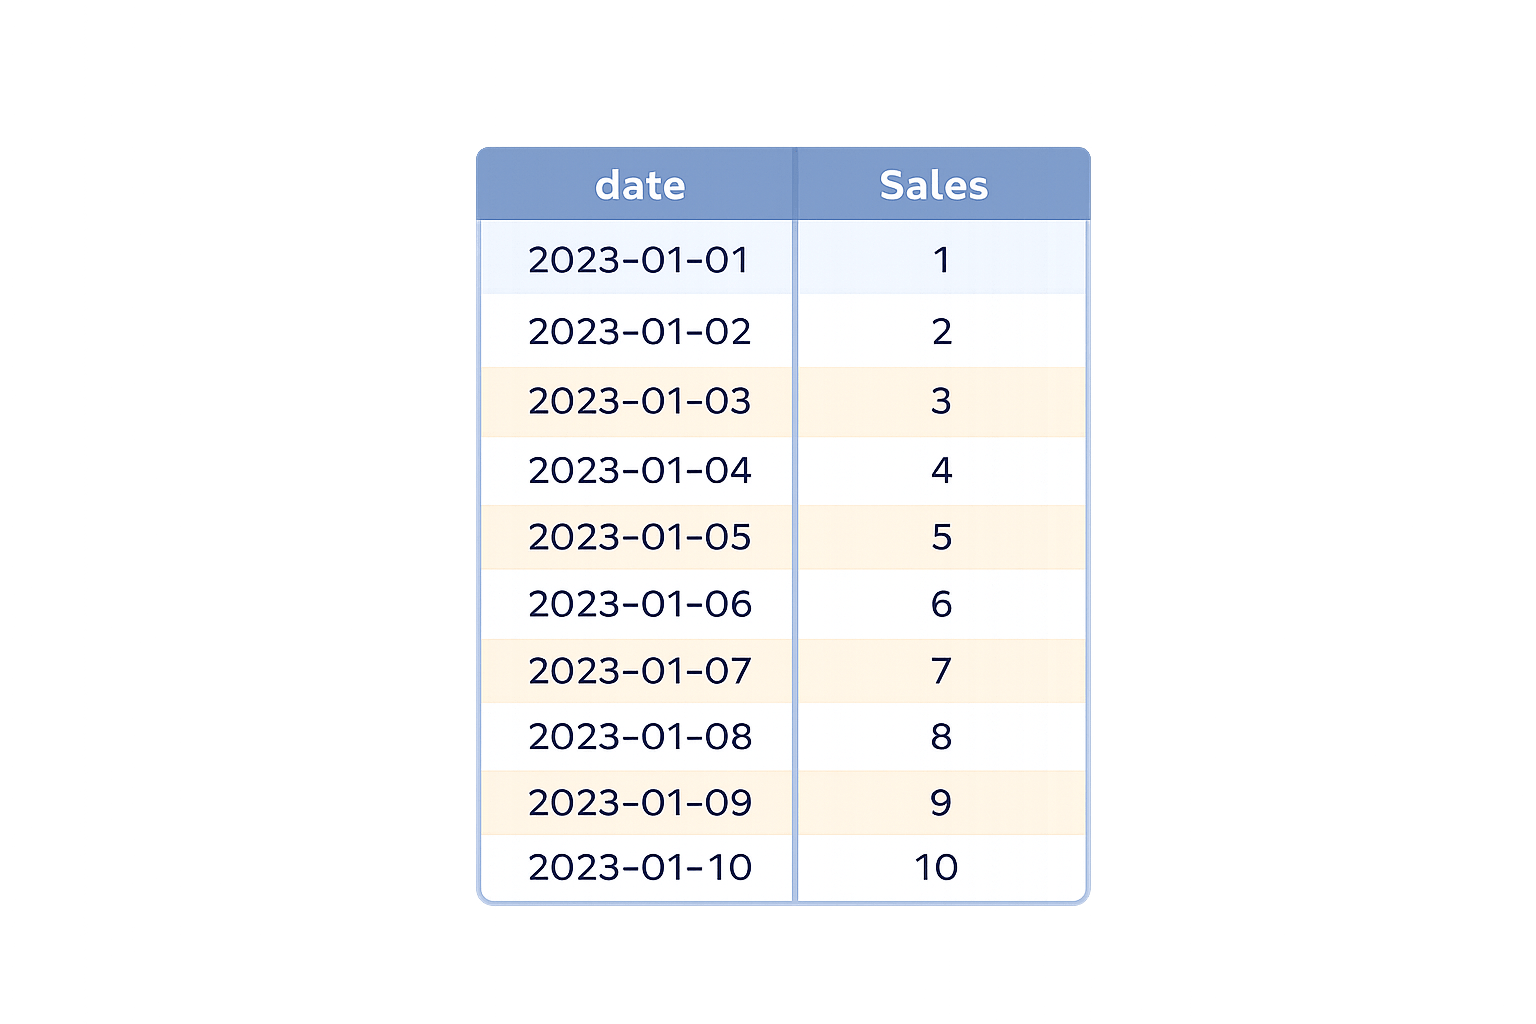
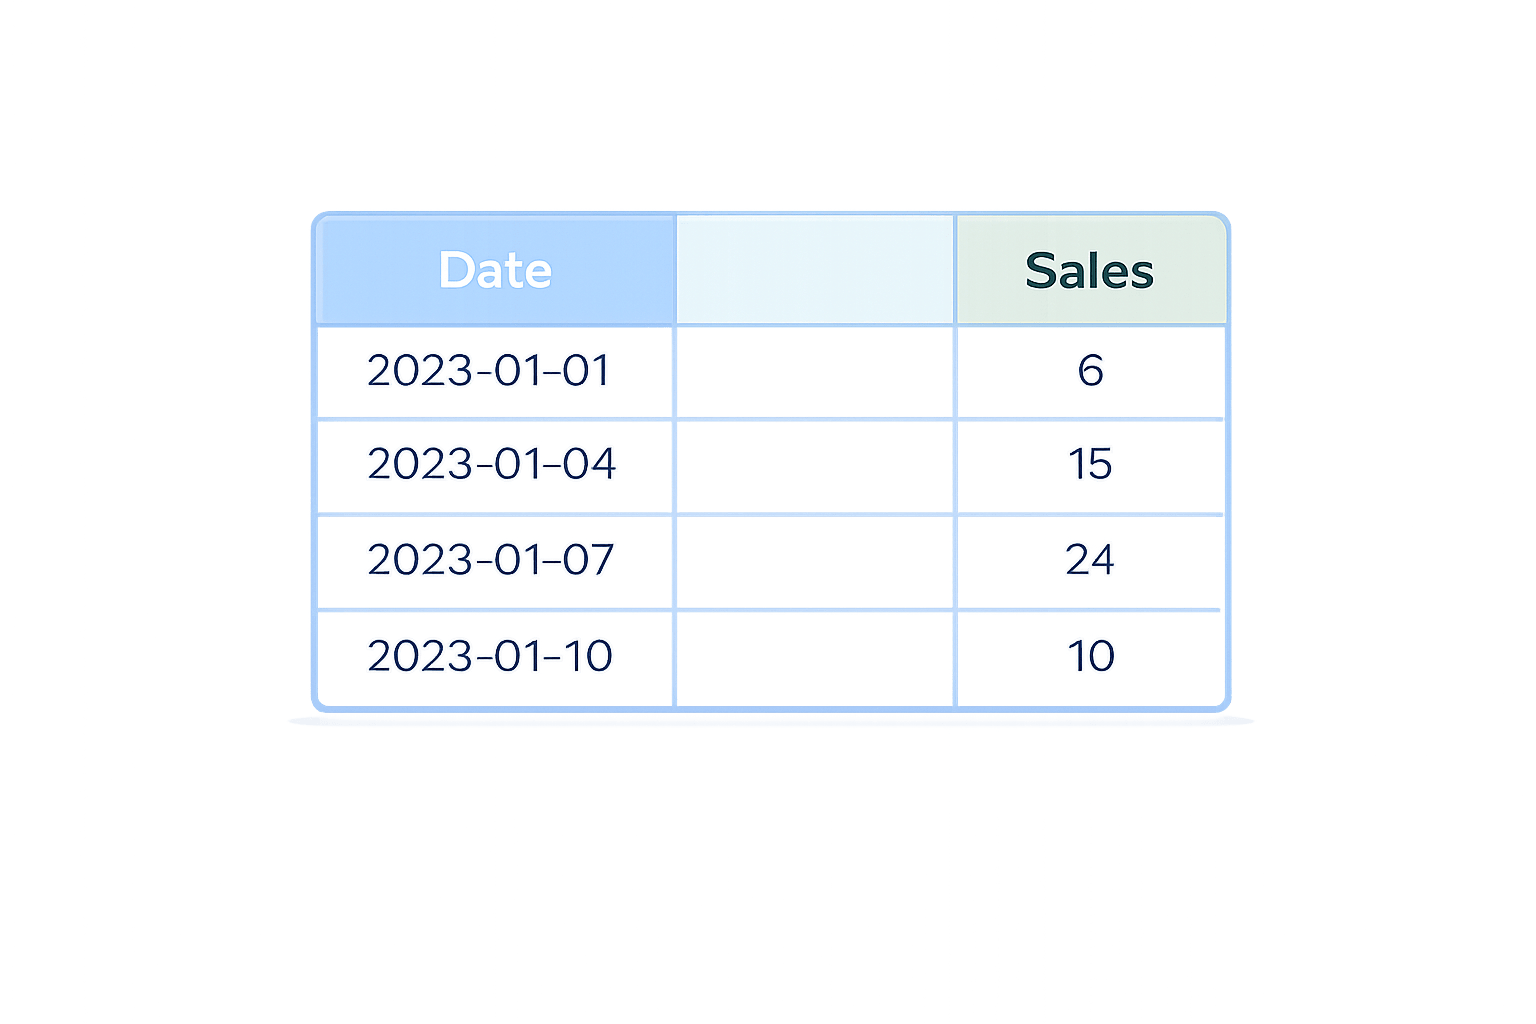
Resampling Time-Series Data
Resampling is the process of changing the time frequency of time-series data to analyze trends at appropriate intervals.
Sample Dataset
date_rng = pd.date_range(start="2023-01-01",
 		   end="2023-01-10", freq="D")
df = pd.DataFrame({"date": date_rng, "Sales": range(1, 11)})
df.set_index("date", inplace=True)
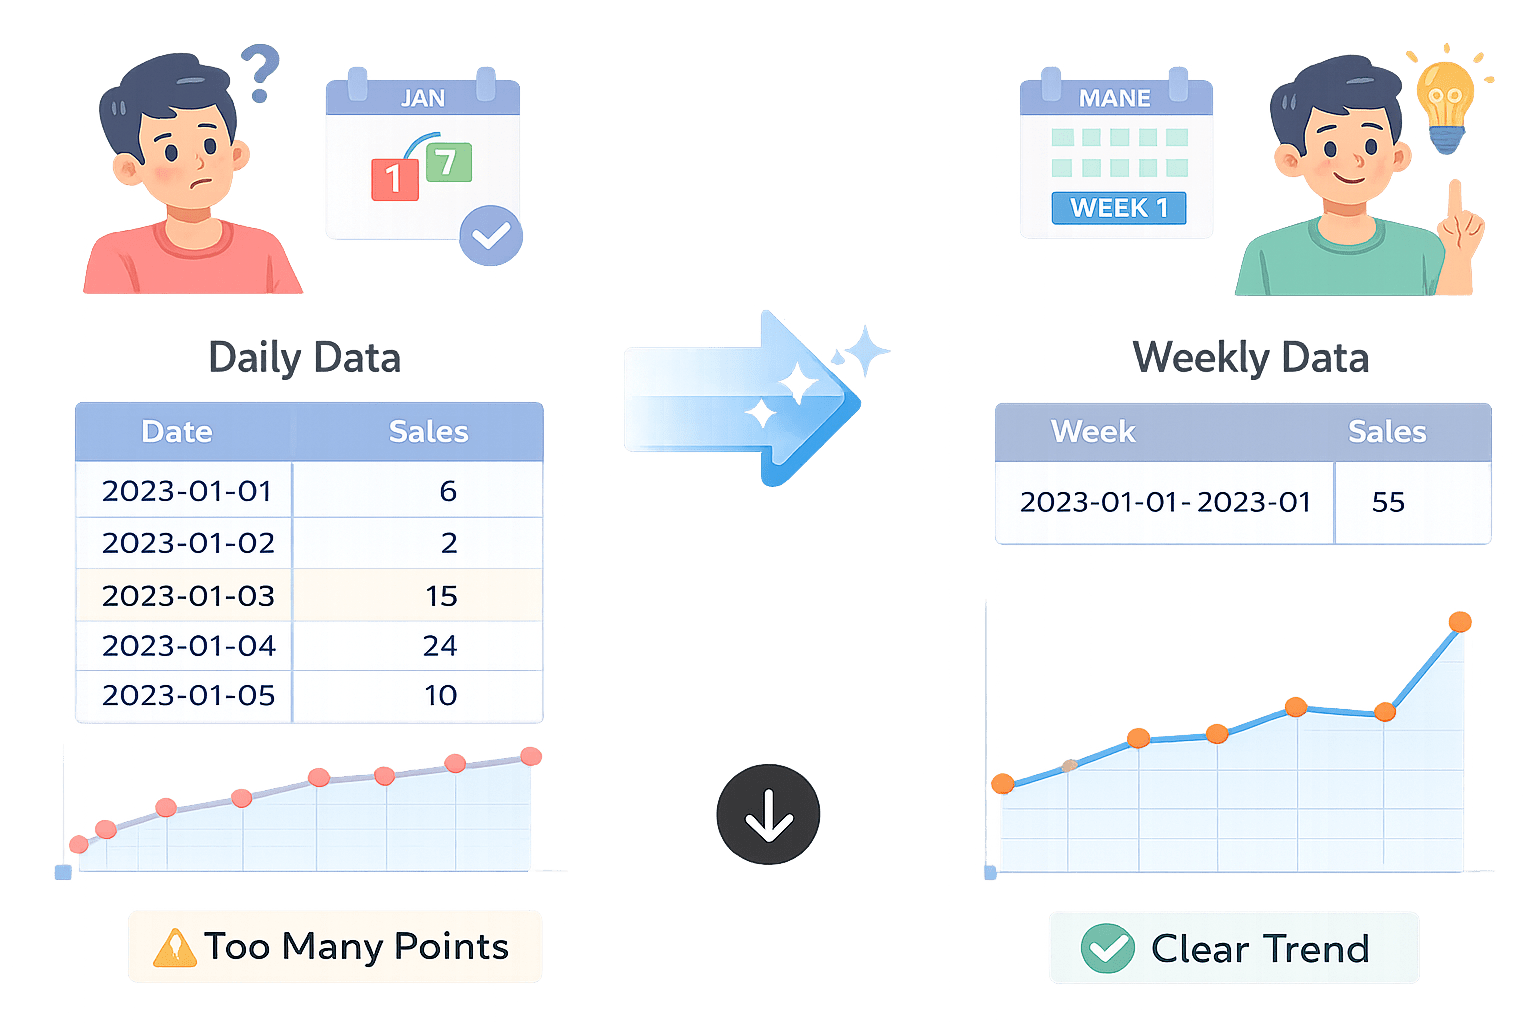
resampled_df = df.resample("3D").sum()
resampled_df
Code
resampled_df = df.resample("3D").sum()
resampled_df
Resampling reduces noise and converts raw time-series data into interpretable trends
Summary
3
Polished data enables reliable analysis and visualization
2
Renaming, joining, aggregating, reshaping, and resampling enhance usability
1
Polishing data improves structure, clarity, and analytical intent
Quiz
What is the main goal of polishing data?
A. Removing errors
B. Improving structure and analytical clarity
C. Reducing dataset size
D. Changing data types
What is the main goal of polishing data?
A. Removing errors
B. Improving structure and analytical clarity
C. Reducing dataset size
D. Changing data types
Quiz-Answer
By Content ITV


