


Content ITV PRO
This is Itvedant Content department
Use this slide if there is no Heading
Note - Create Content inside Red Layout
[Delete Red Outline After creating slide]
Learning Outcome(Slide2)
6
Basics of branding and messaging
5
Target audience and segmentation
4
Different marketing channels
3
Creating value for customers
2
Understanding customer needs
1
What marketing means ?
Choose cool, soft colors instead of vibrant colors
Max 6 Points for Summary & Min 4
Topic Name-Recall(Slide3)
Hook/Story/Analogy(Slide 4)
Transition from Analogy to Technical Concept(Slide 5)
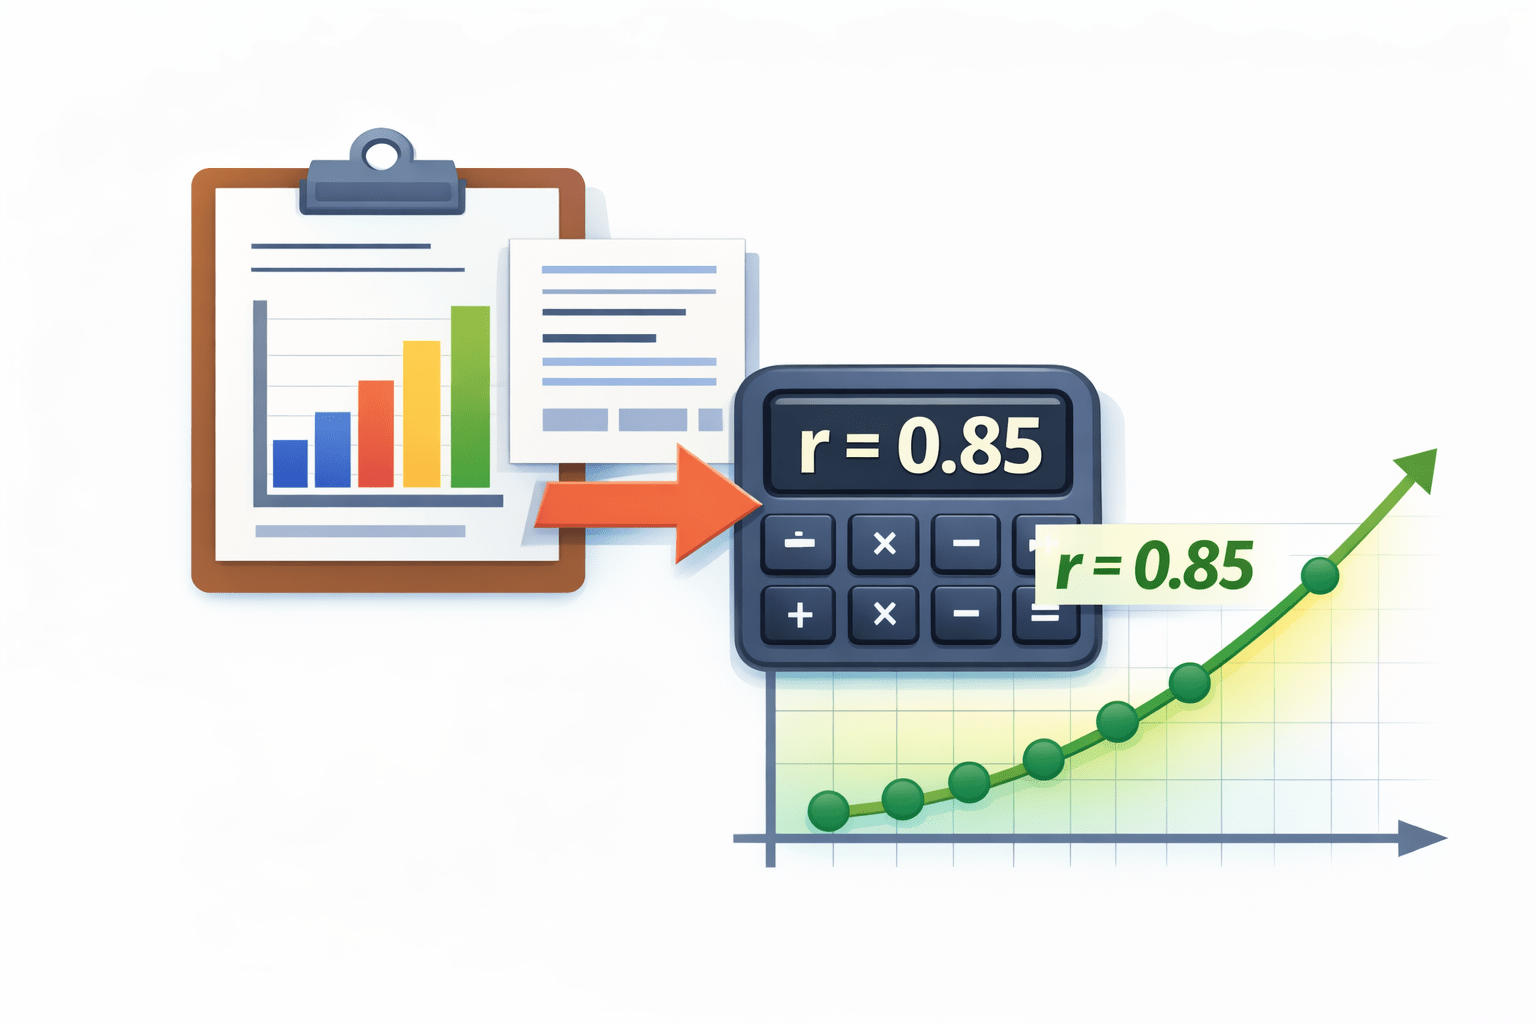
Correlation Analysis
Correlation measures the strength and direction of a linear relationship between two numerical variables.
In simple terms:
When one value changes, does the other also change — and how strongly?
Why it is required
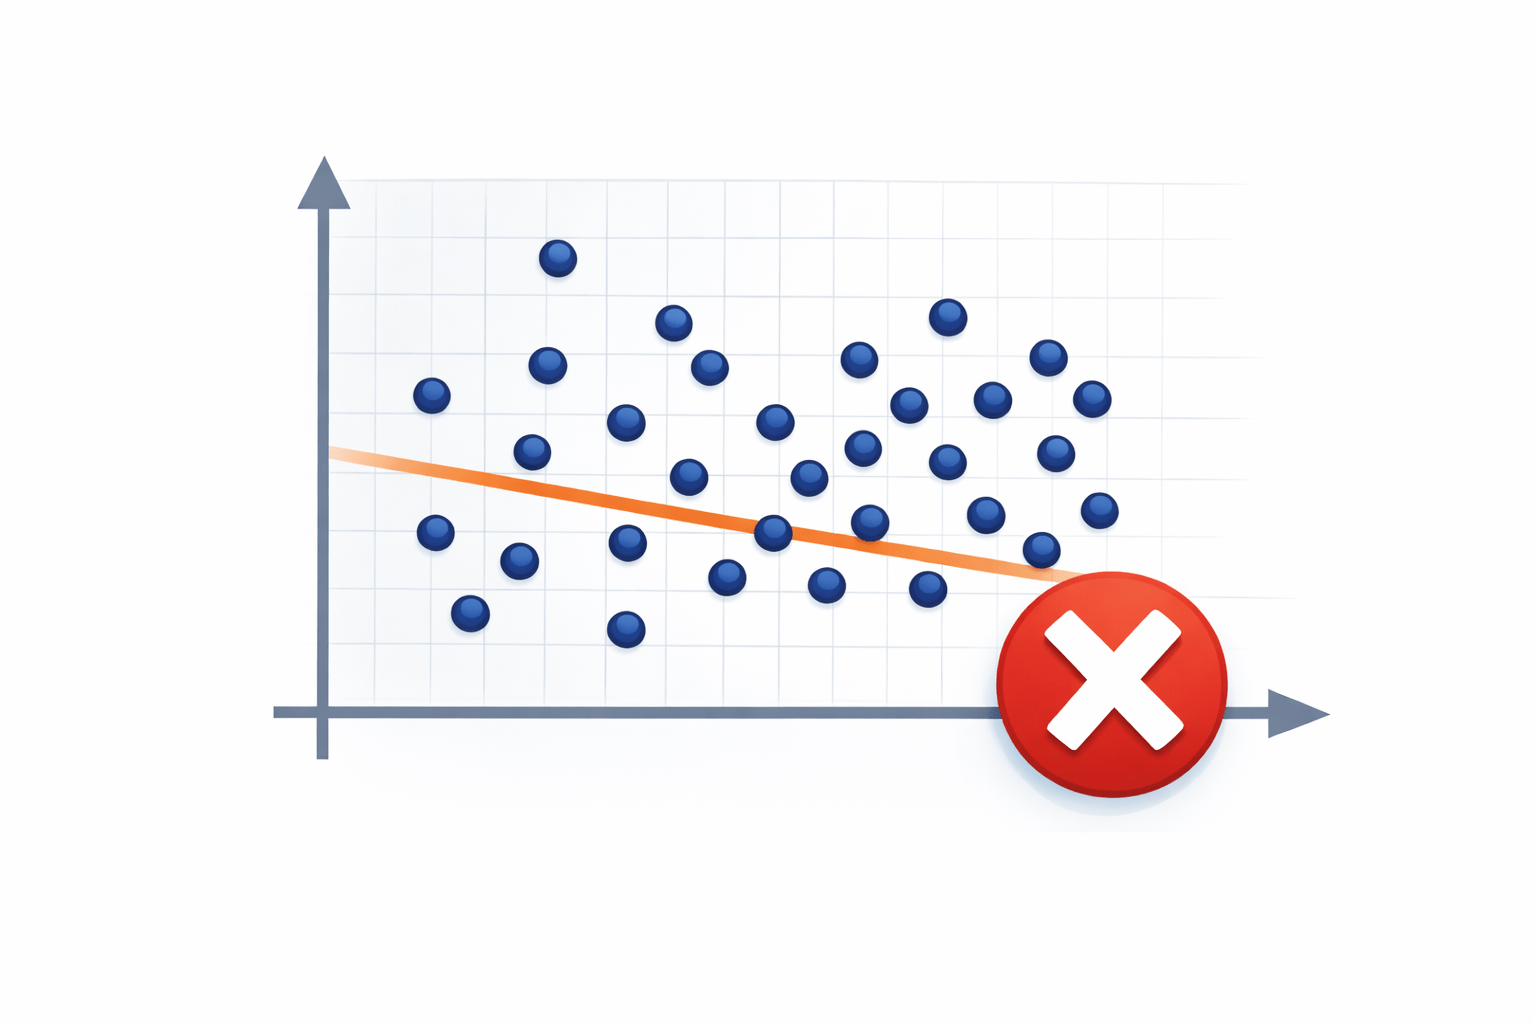
Visual inspection can be misleading.
Correlation provides numerical confirmation of relationships before visualization.
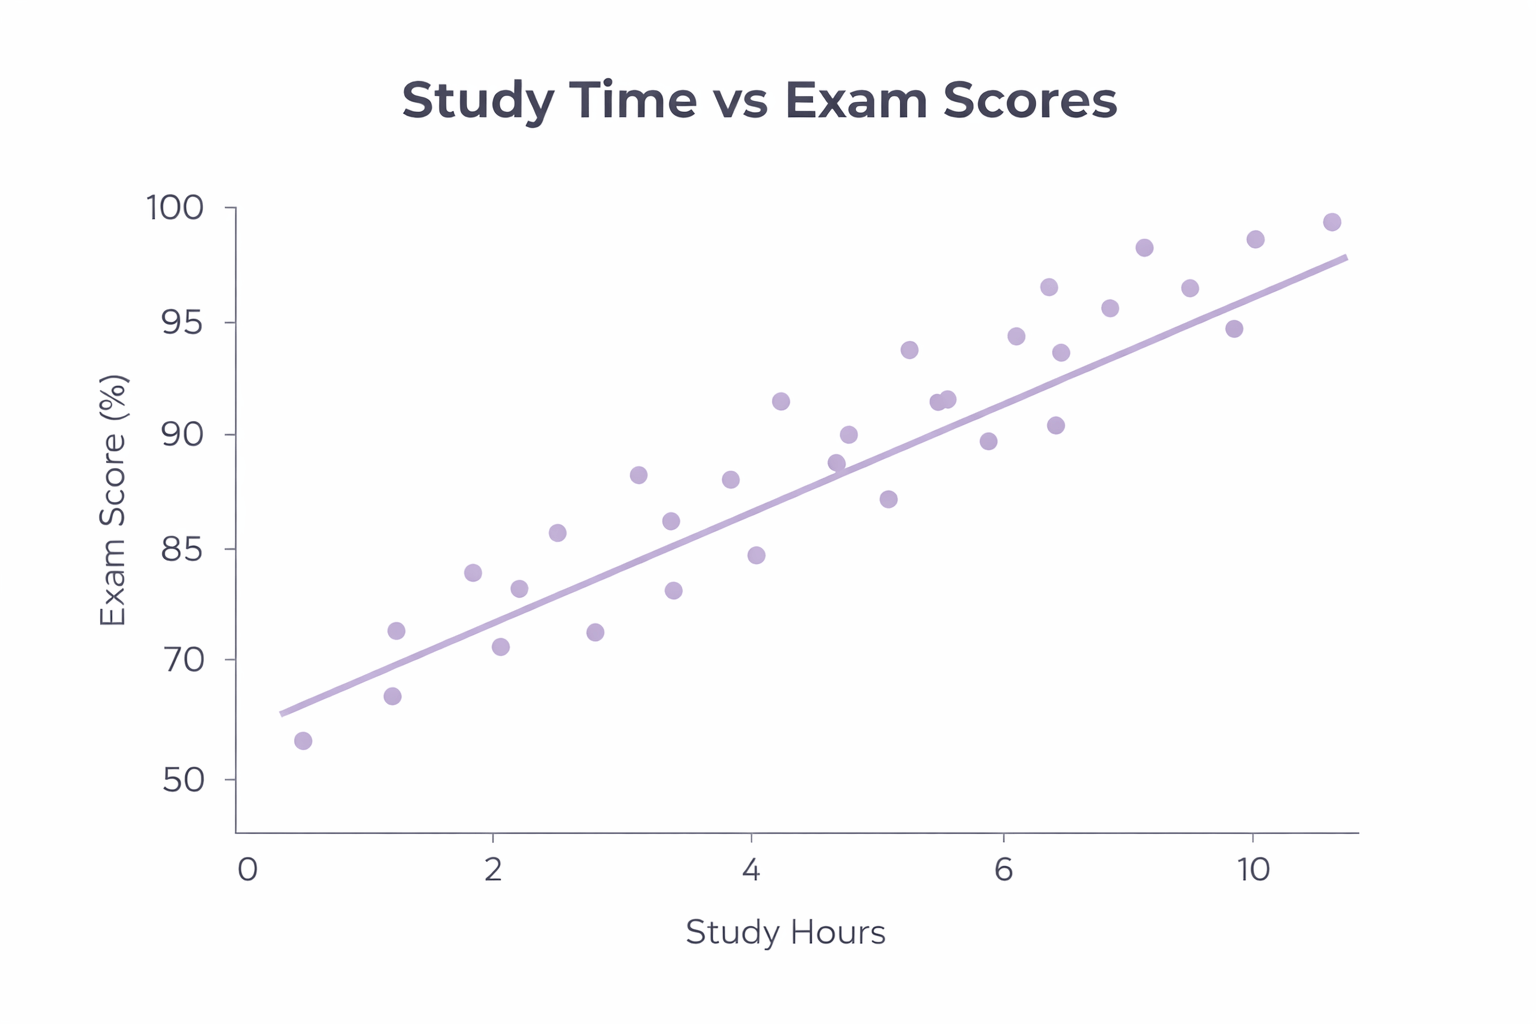
For Example:
Does studying more lead to better exam scores?
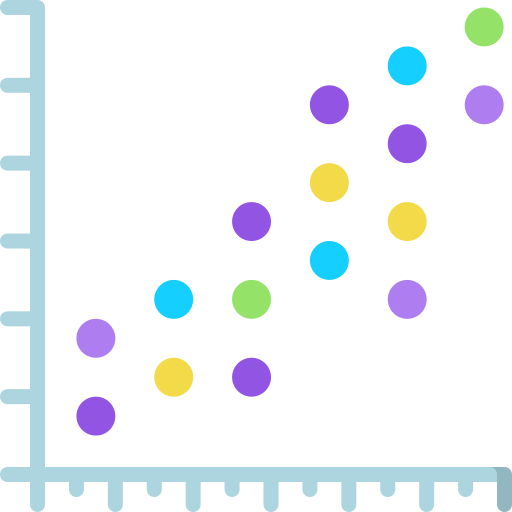
In this scatter plot, every single point represents one student
Sample Data
| StudyHours | Marks |
|---|---|
| 2 | 50 |
| 4 | 70 |
| 6 | 85 |
| 10 | 90 |
import pandas as pd

df = pd.DataFrame (
{
    "StudyHours": [2, 4, 6, 10],
    "Marks": [50, 70, 85, 90]
})
Example Code
#Output

np.float64(0.9096512726248552)
df["StudyHours"].corr(df["Marks"])How to interpret
Perfect Positive (r = 1)
Strong Positive (r ~ 0.7)
No Correlation (r = 0)
Strong Negative (r ~ -0.7)
Perfect Negative (r = -1)
This confirms the relationship before plotting.
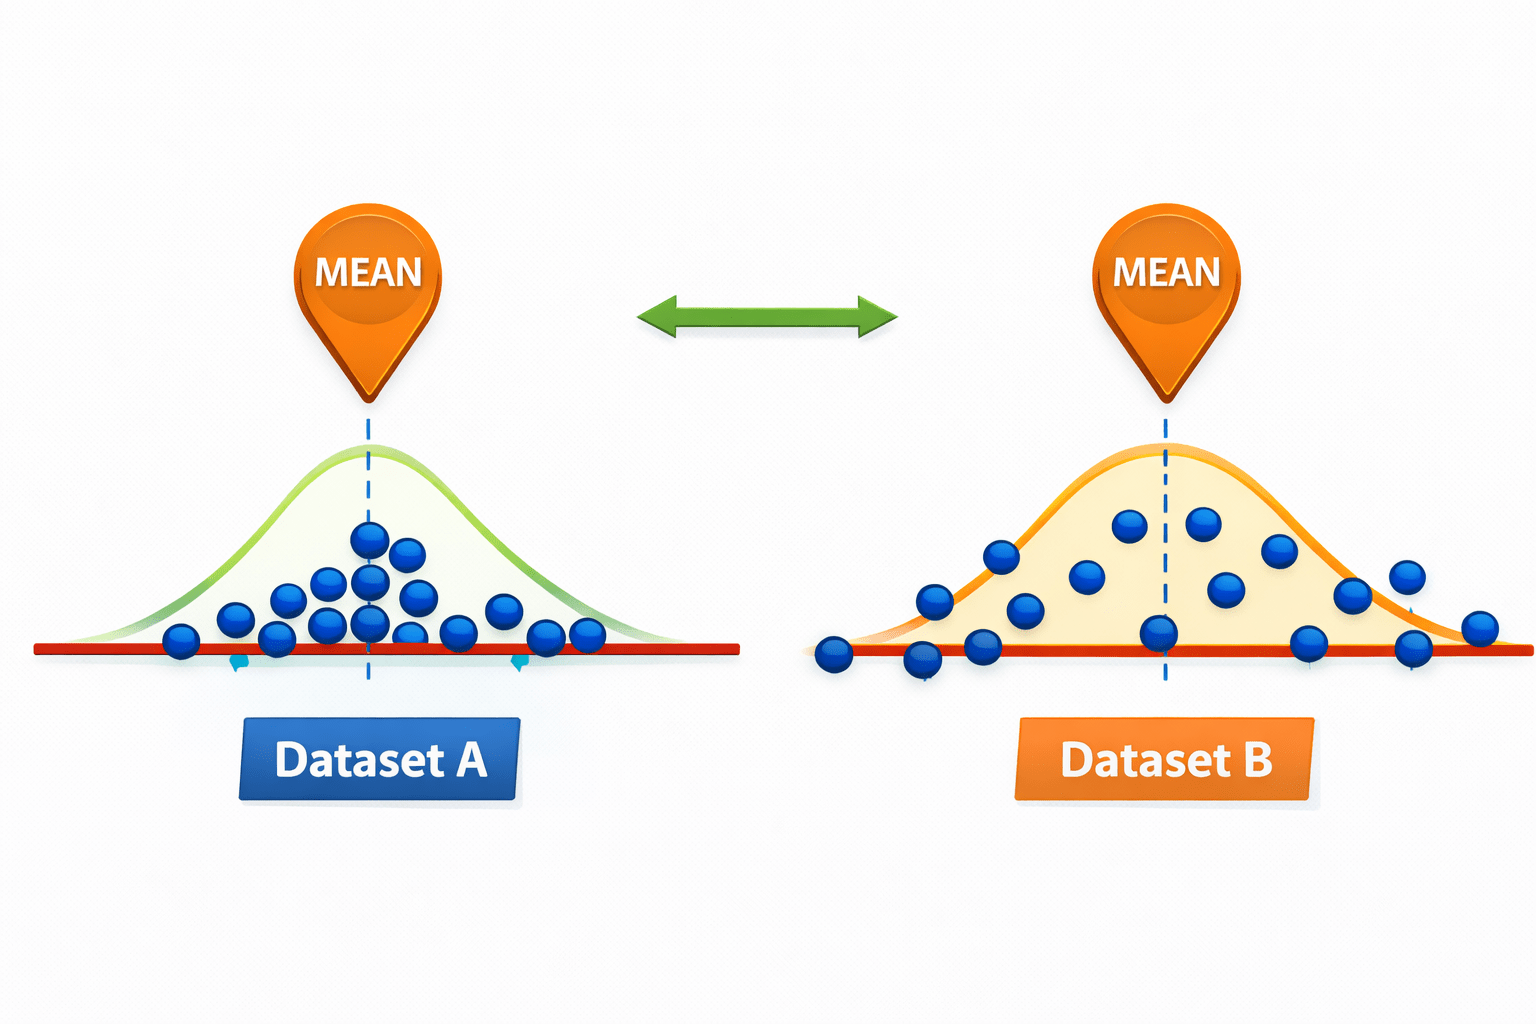
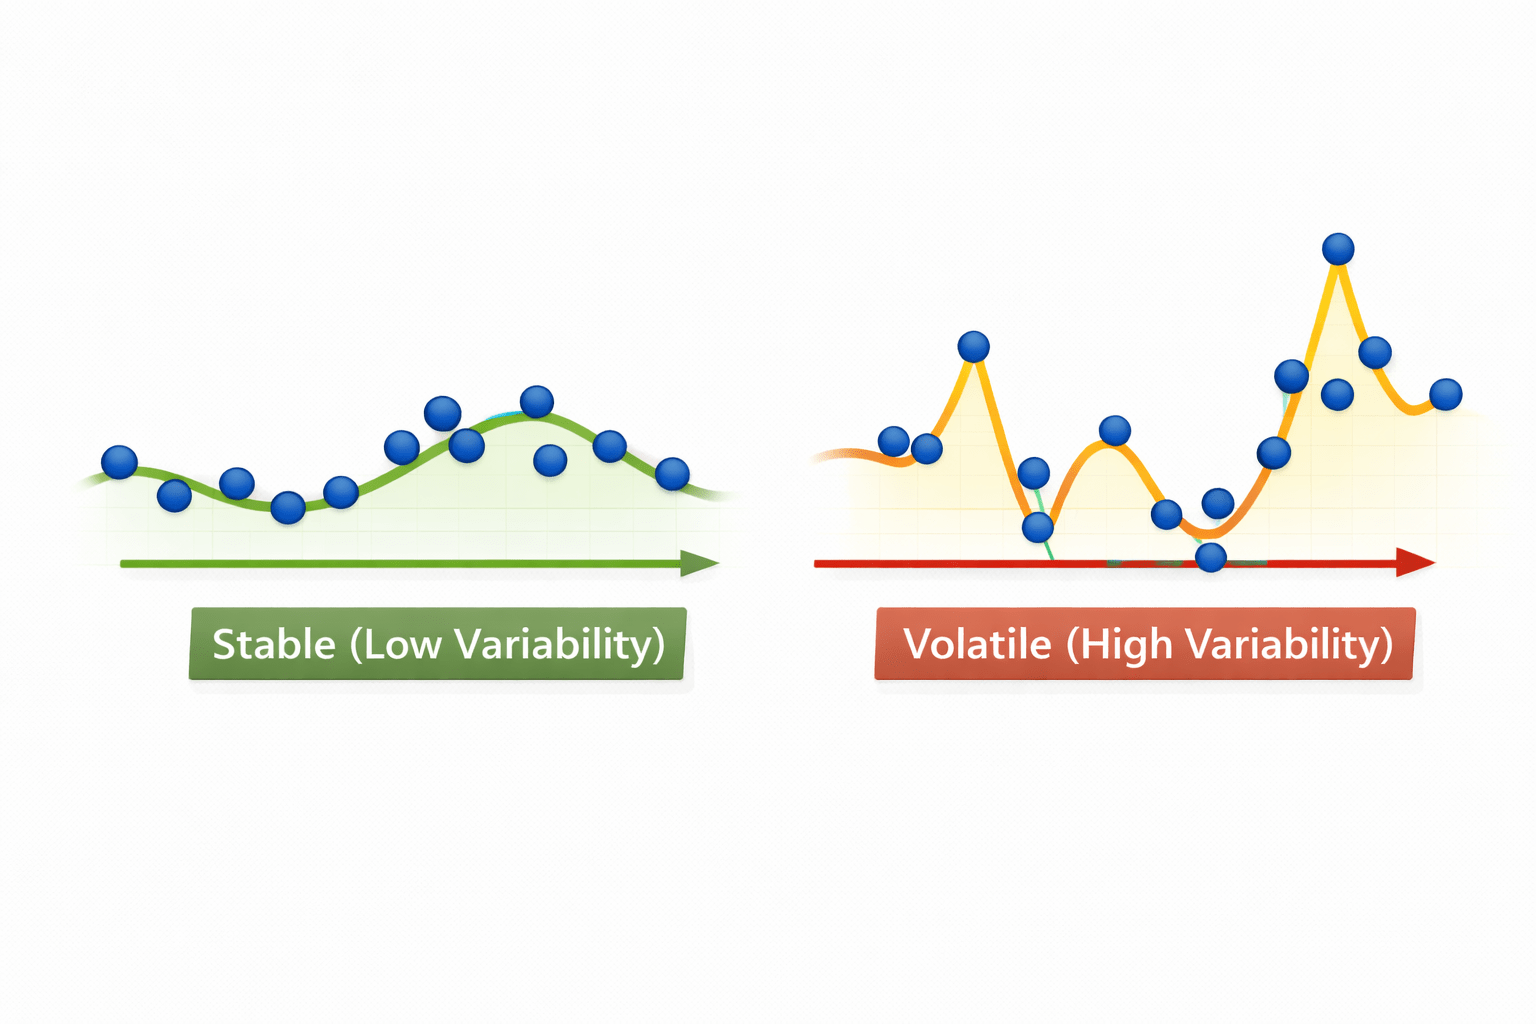
Variability and Spread Analysis
Variability describes how much values differ from each other, even if their average is the same.
Why it is required
Two datasets can have the same mean but behave very differently.
Variability explains stability vs volatility.
Example :
Sample Data
sales_df = pd.DataFrame(
{
    "Day": [1, 2, 3, 4, 5],
    "Sales": [100, 102, 98, 101, 99]
})

sales_df["Sales"].std()
Example Code
#Output

1.5811388300841898
How to interpret
Low value → consistent, stable data
High value → volatile, unpredictable data
Percent Change Analysis
Percent change measures the relative change between consecutive values.
Why it is required
Absolute numbers hide growth speed.
Percent change reveals momentum.
Core Concepts (.....Slide N-3)
Core Concepts (.....Slide N-3)
Core Concepts (.....Slide N-3)
Core Concepts (.....Slide N-3)
Core Concepts (.....Slide N-3)
Core Concepts (.....Slide N-3)
Core Concepts (.....Slide N-3)
Core Concepts (.....Slide N-3)
Core Concepts (.....Slide N-3)
Core Concepts (.....Slide N-3)
Core Concepts (.....Slide N-3)
Summary
5
Build strong branding
4
Use different marketing channels
3
Target the right audience
2
Create and communicate value
1
Understand customer needs
Choose cool, soft colors instead of vibrant colors
Max 5 Points for Summary & Min 2
Quiz
Which platform is mainly used for professional networking and B2B marketing ?
A. Facebook
B. Instagram
C. LinkedIn
D. Snapchat
Quiz-Answer
Which platform is mainly used for professional networking and B2B marketing ?
A. Facebook
B. Instagram
C. LinkedIn
D. Snapchat
By Content ITV


