Weather Forecasting using ARIMA & SARIMA Model

Stationarity & Differencing


Learning Outcome
5
Prepare time series data for ARIMA modeling
4
Apply differencing to remove trends
3
Explain types of stationarity
2
Identify non-stationary time series patterns
1
Understand what stationarity means
Recall
Before this topic you already learned
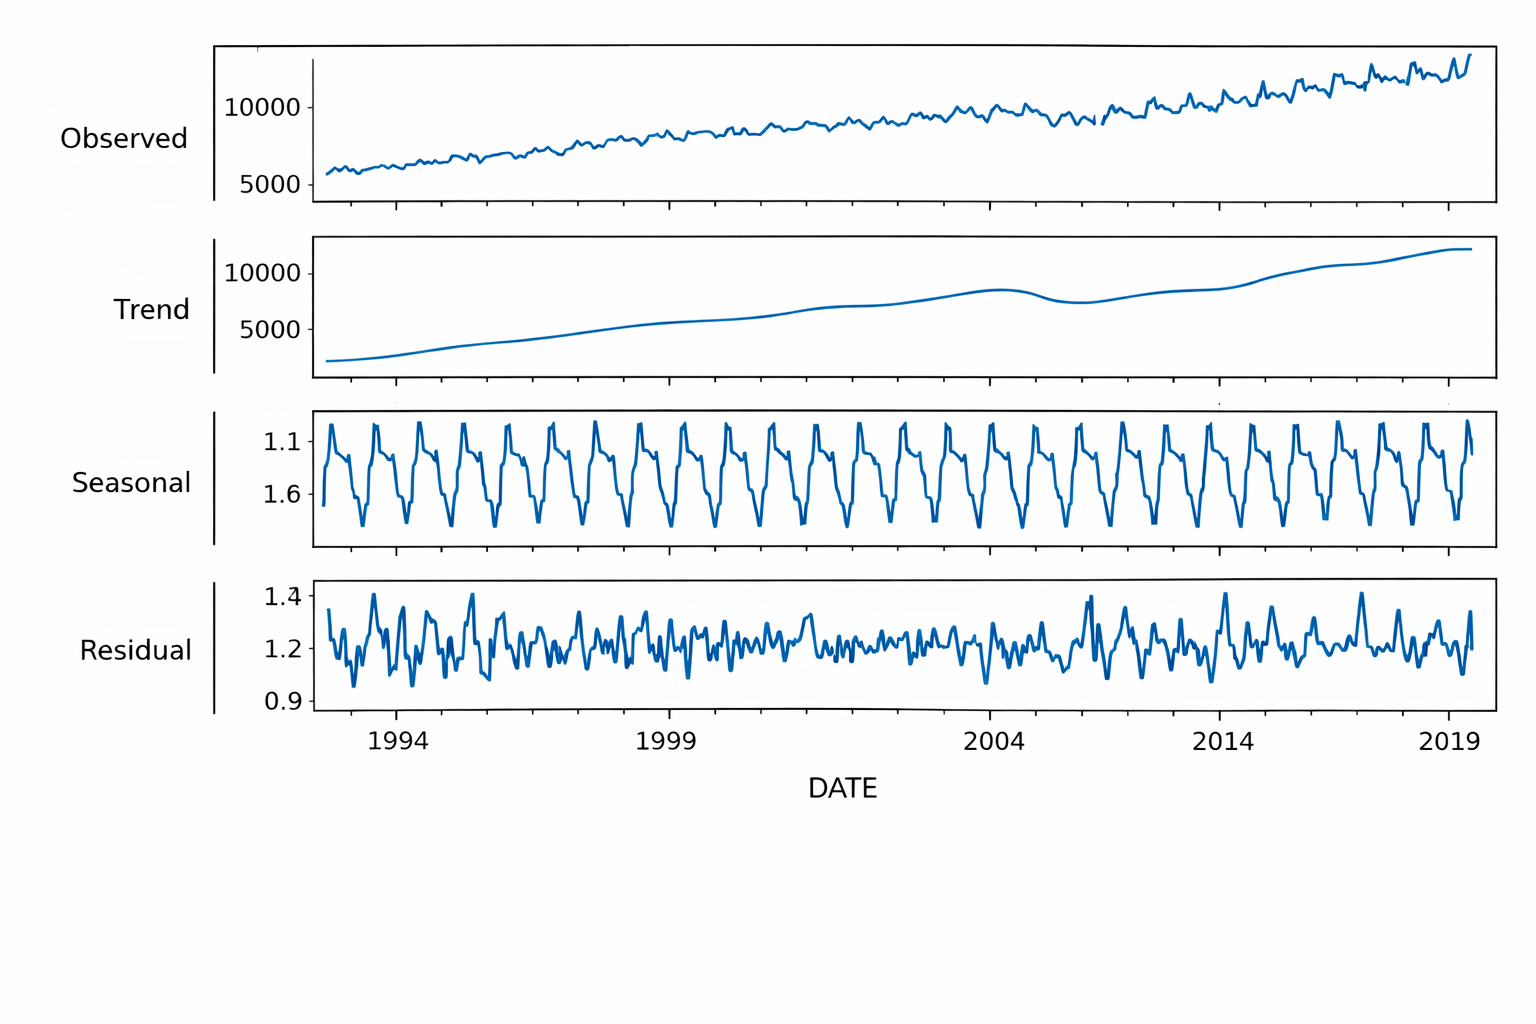
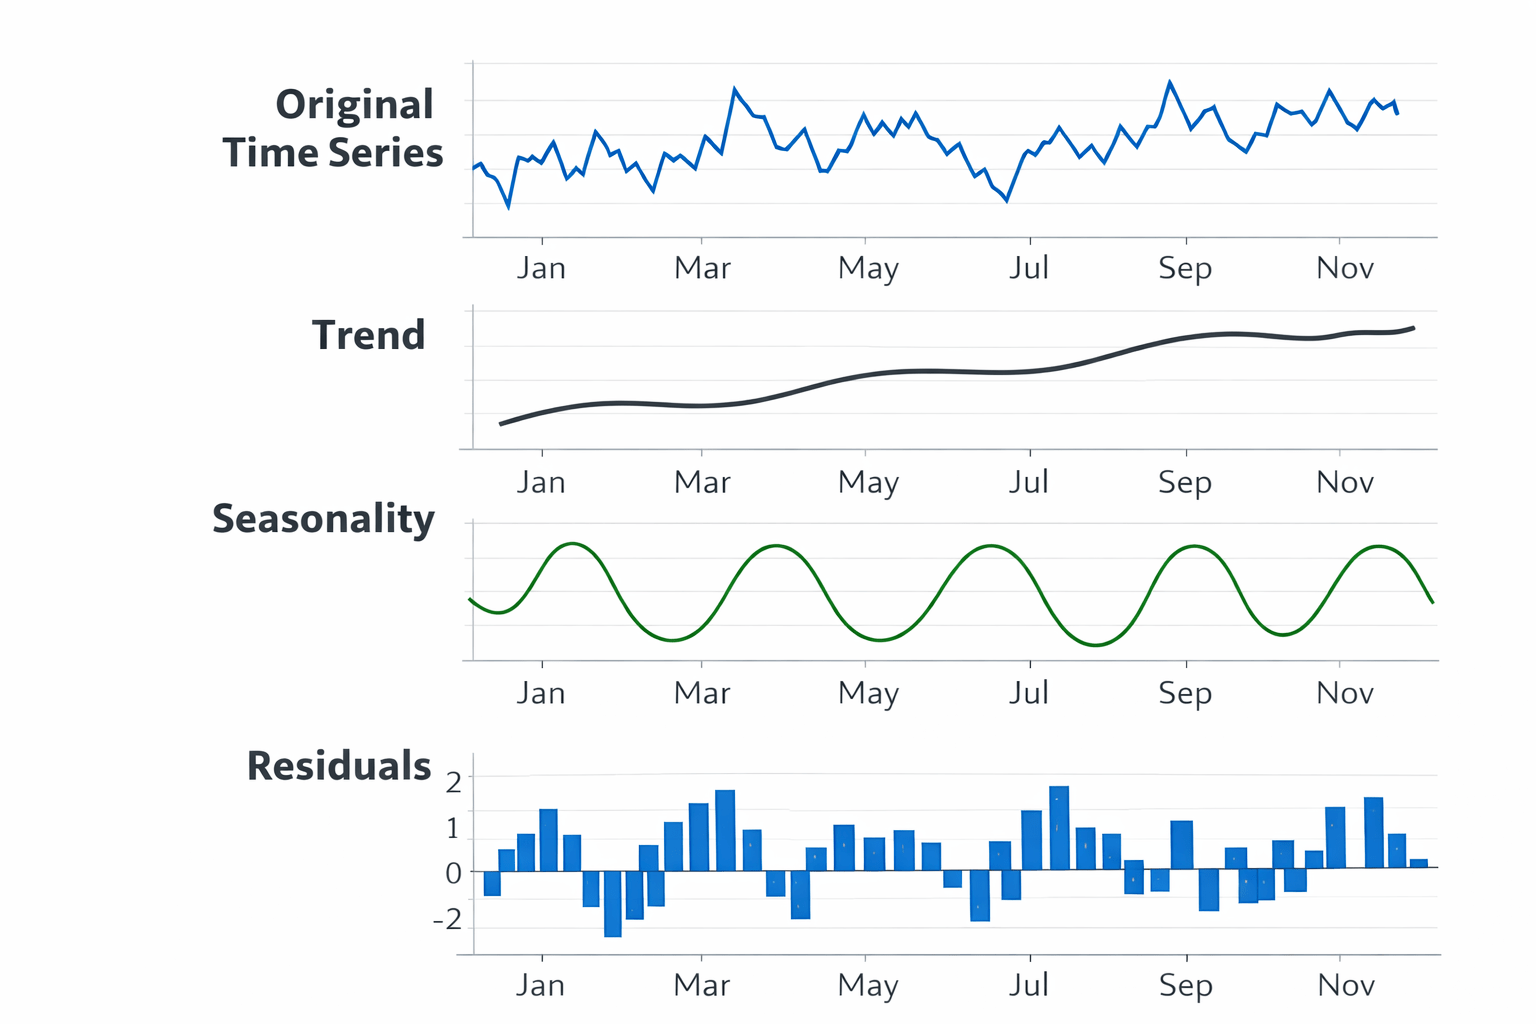
- Time Series Components
- Trend
- Seasonality
- Noise
- Basic Time Series Plots
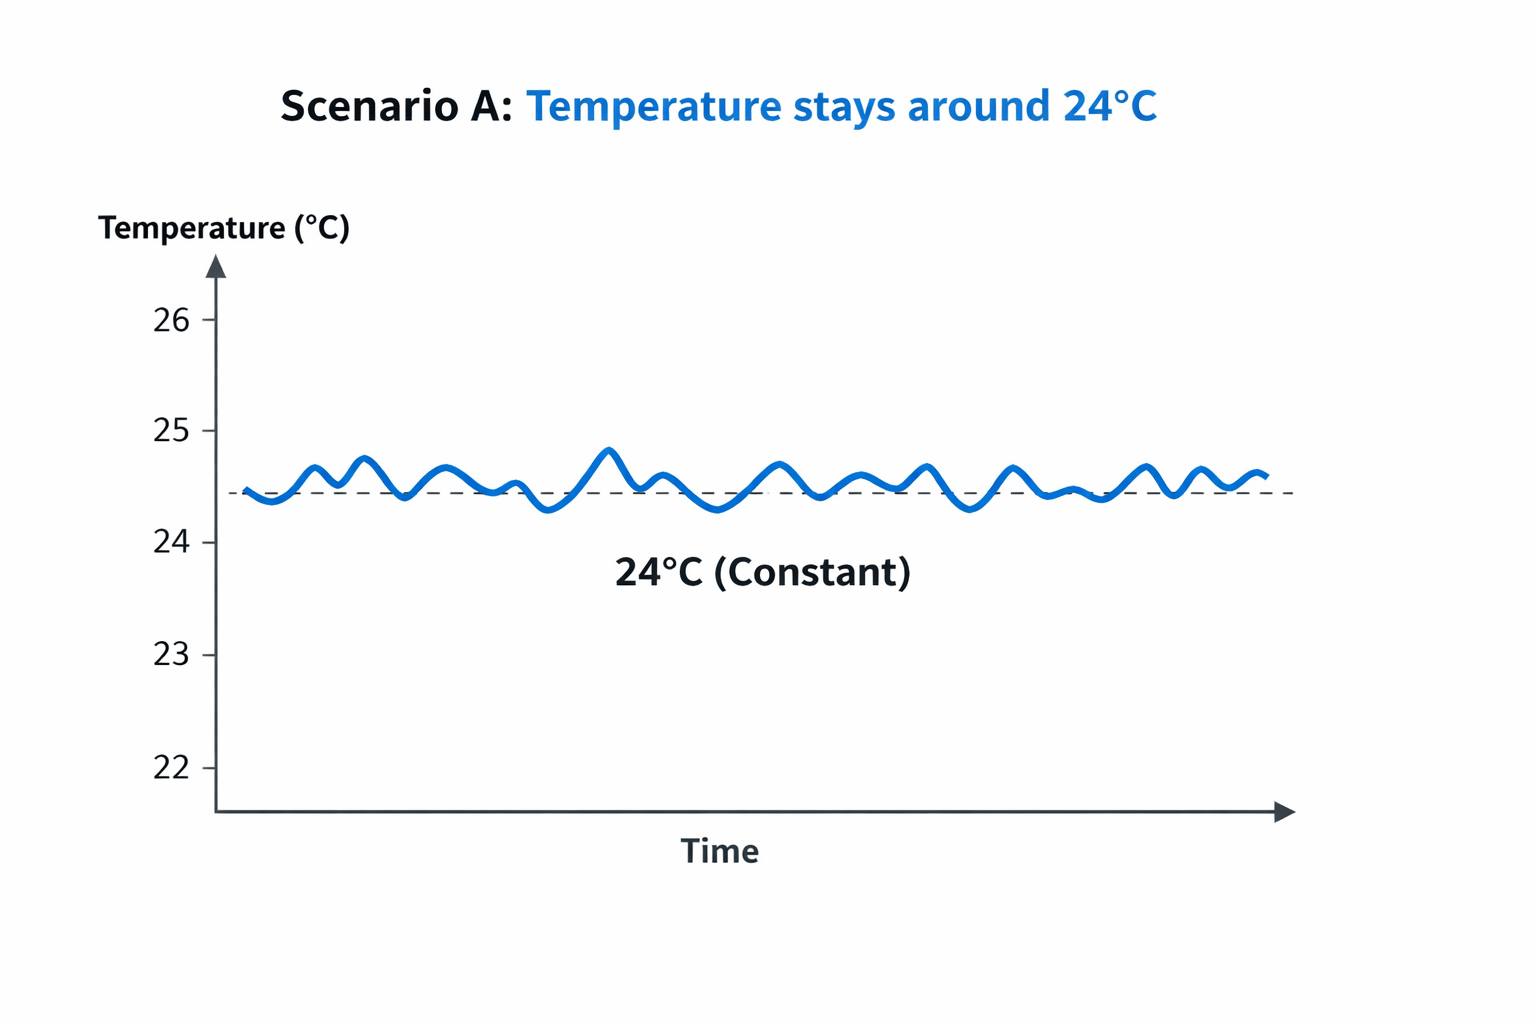
Imagine measuring temperature in a room
Scenario A → Stable pattern
This is the idea of Stationarity
Scenario A
Temperature stays around 24°C
Scenario B
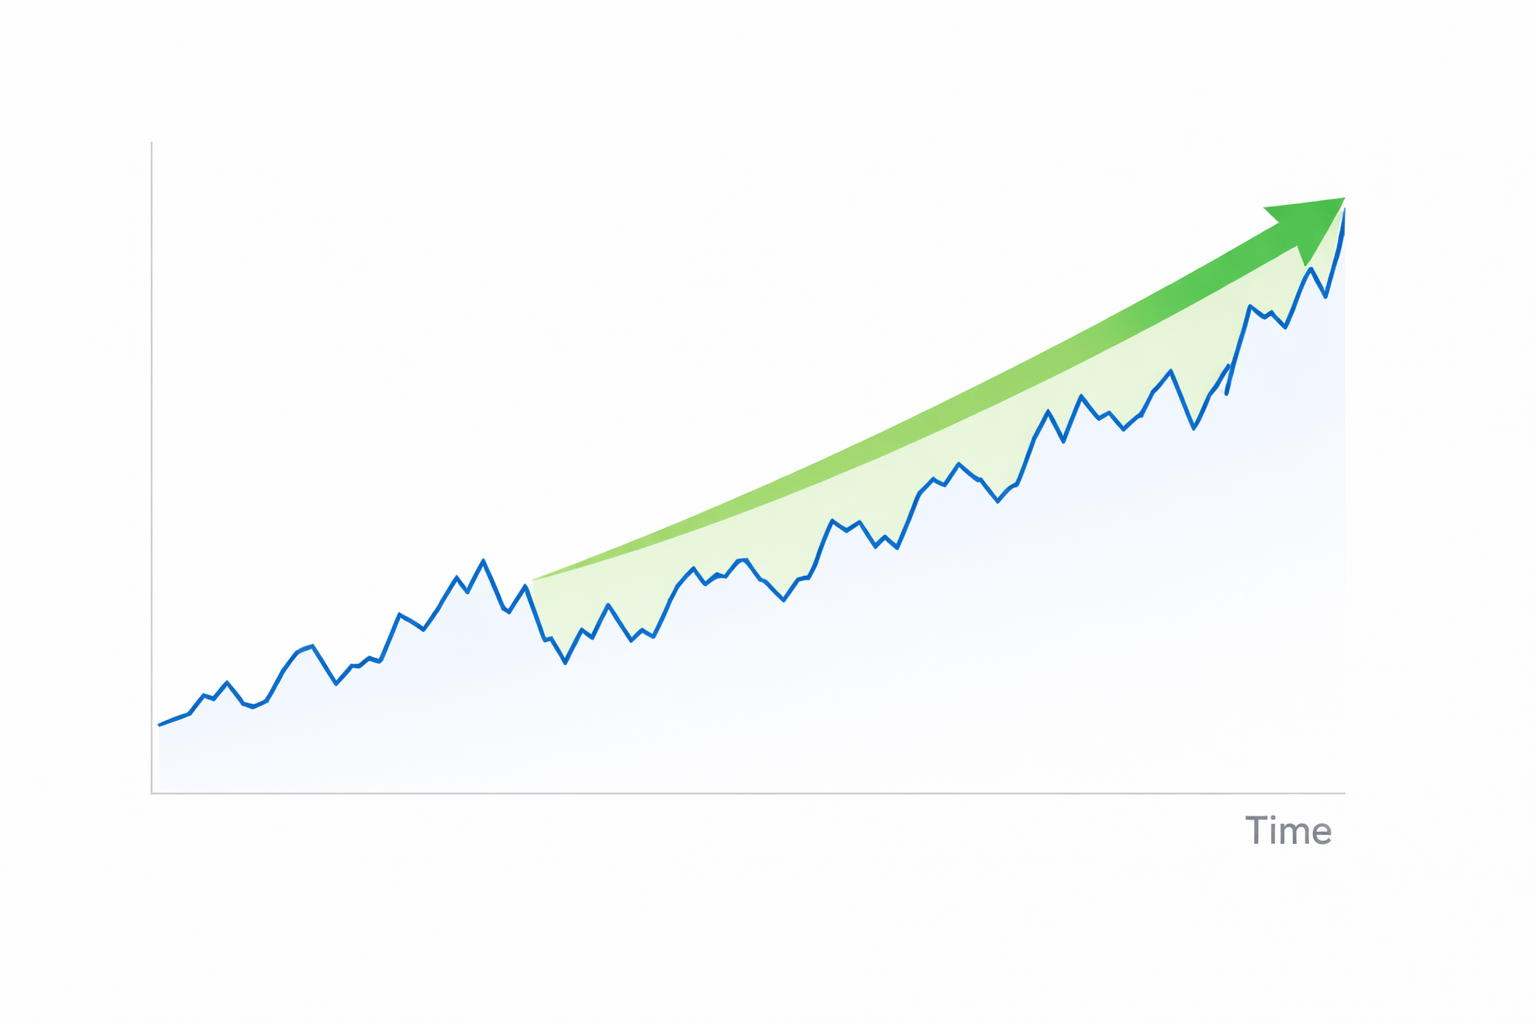
Temperature keeps increasing every hour
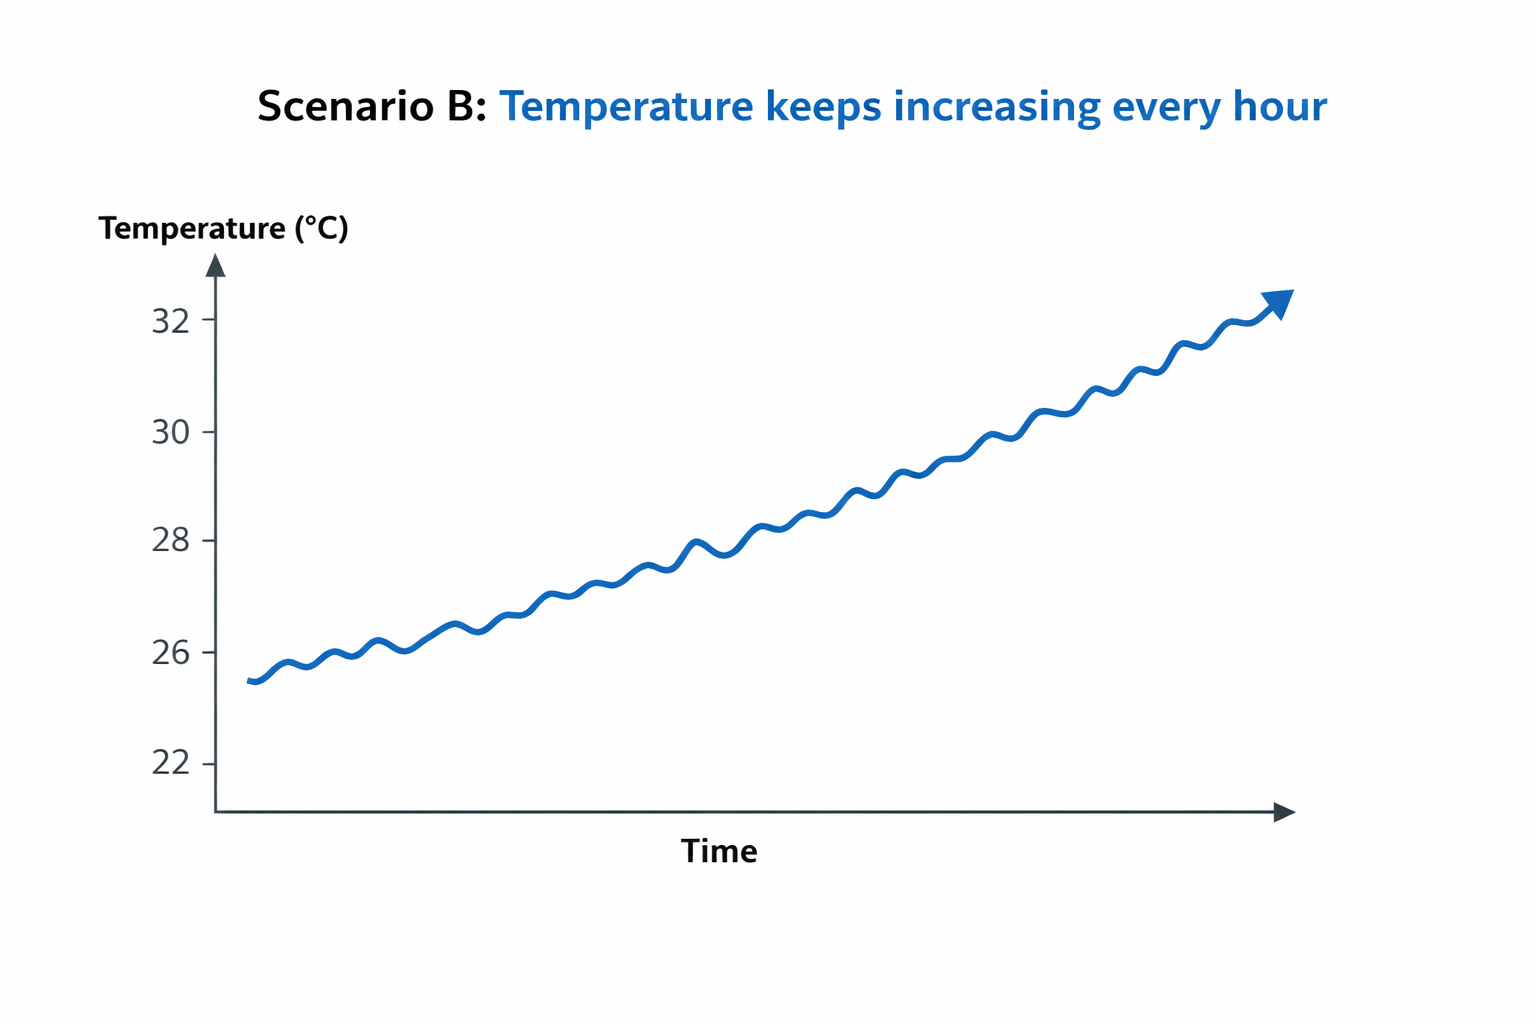
Which one is easier to predict?

Machine learning models prefer stable data patterns.
If patterns keep changing
Model becomes unreliable.
Therefore we need:
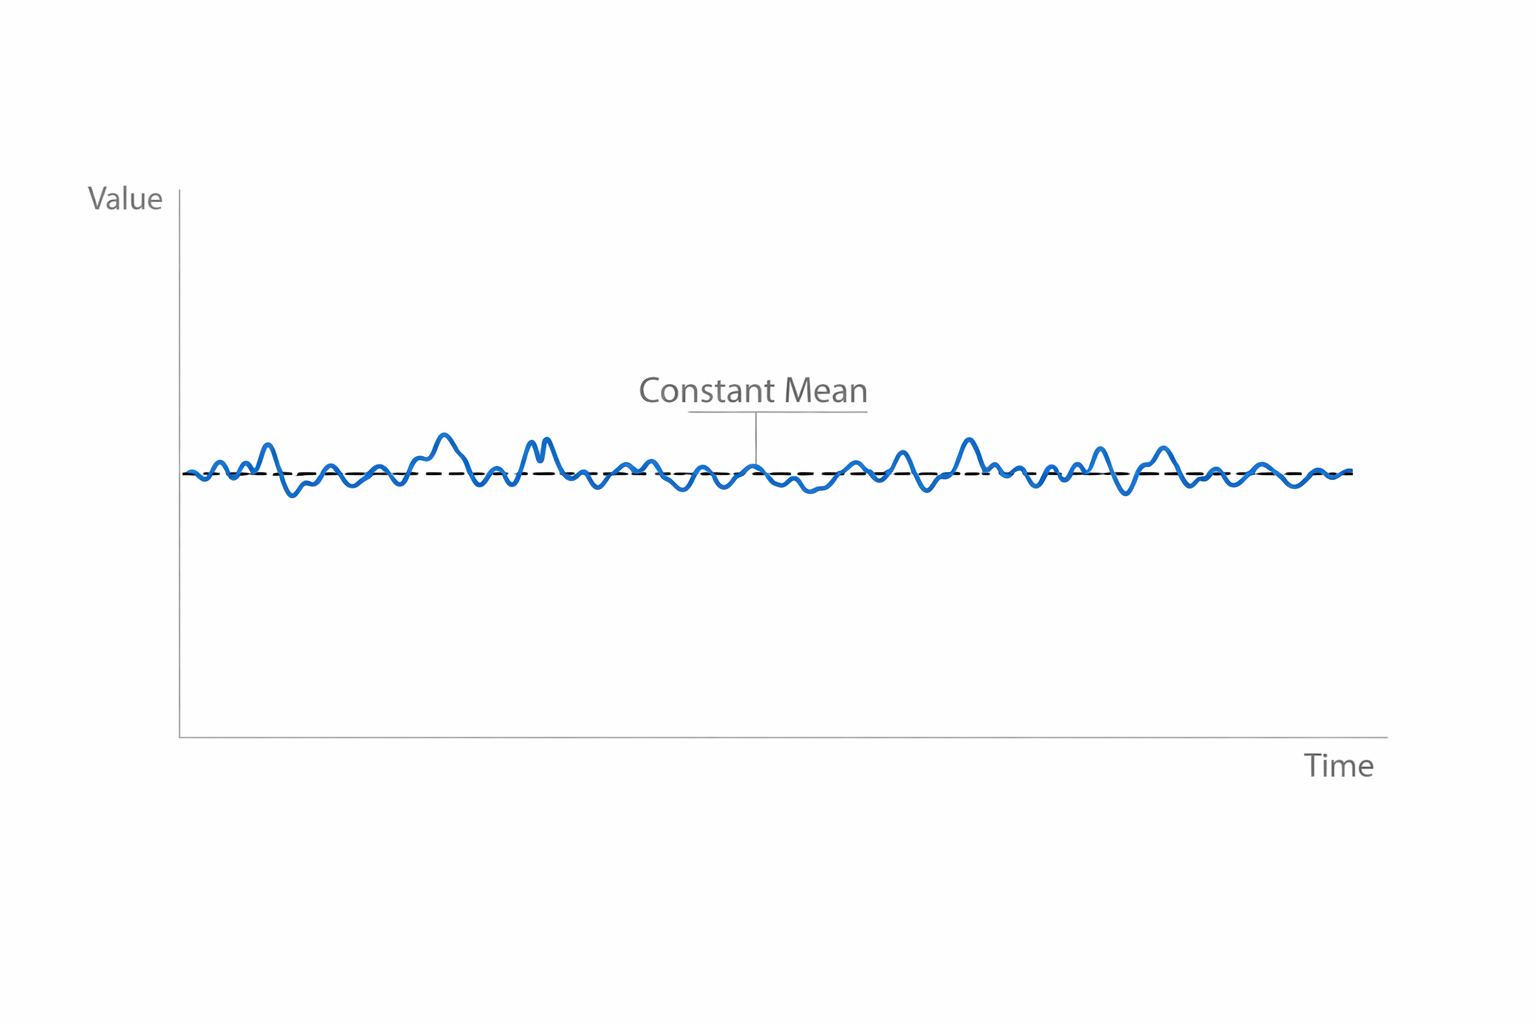
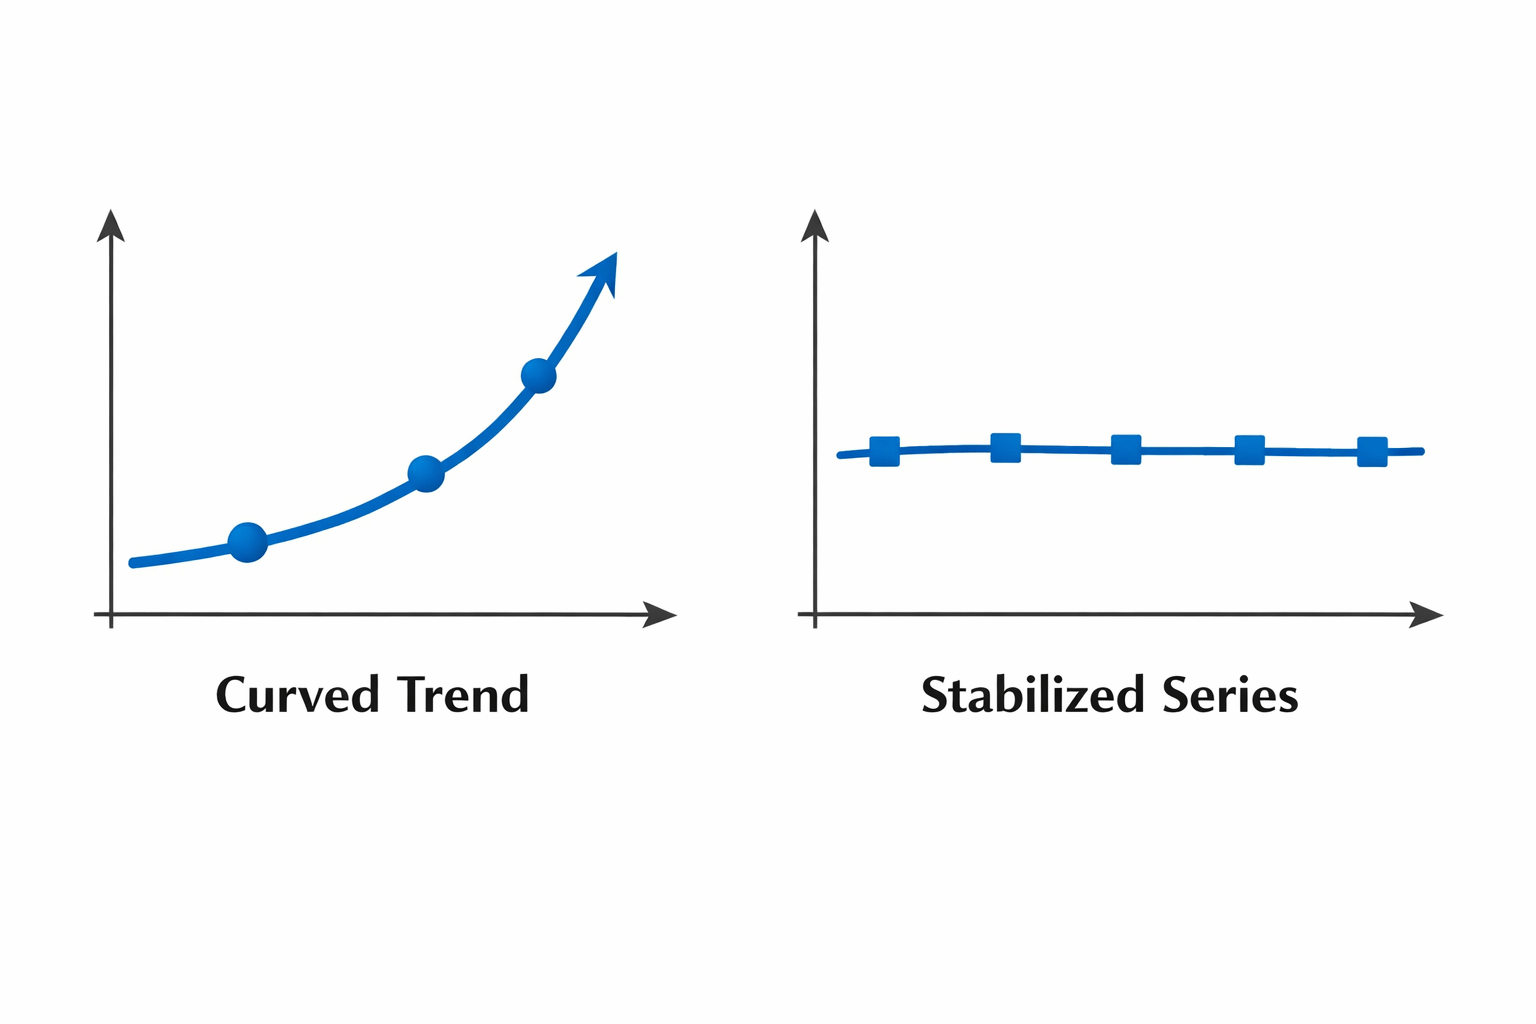
Stationary Time Series
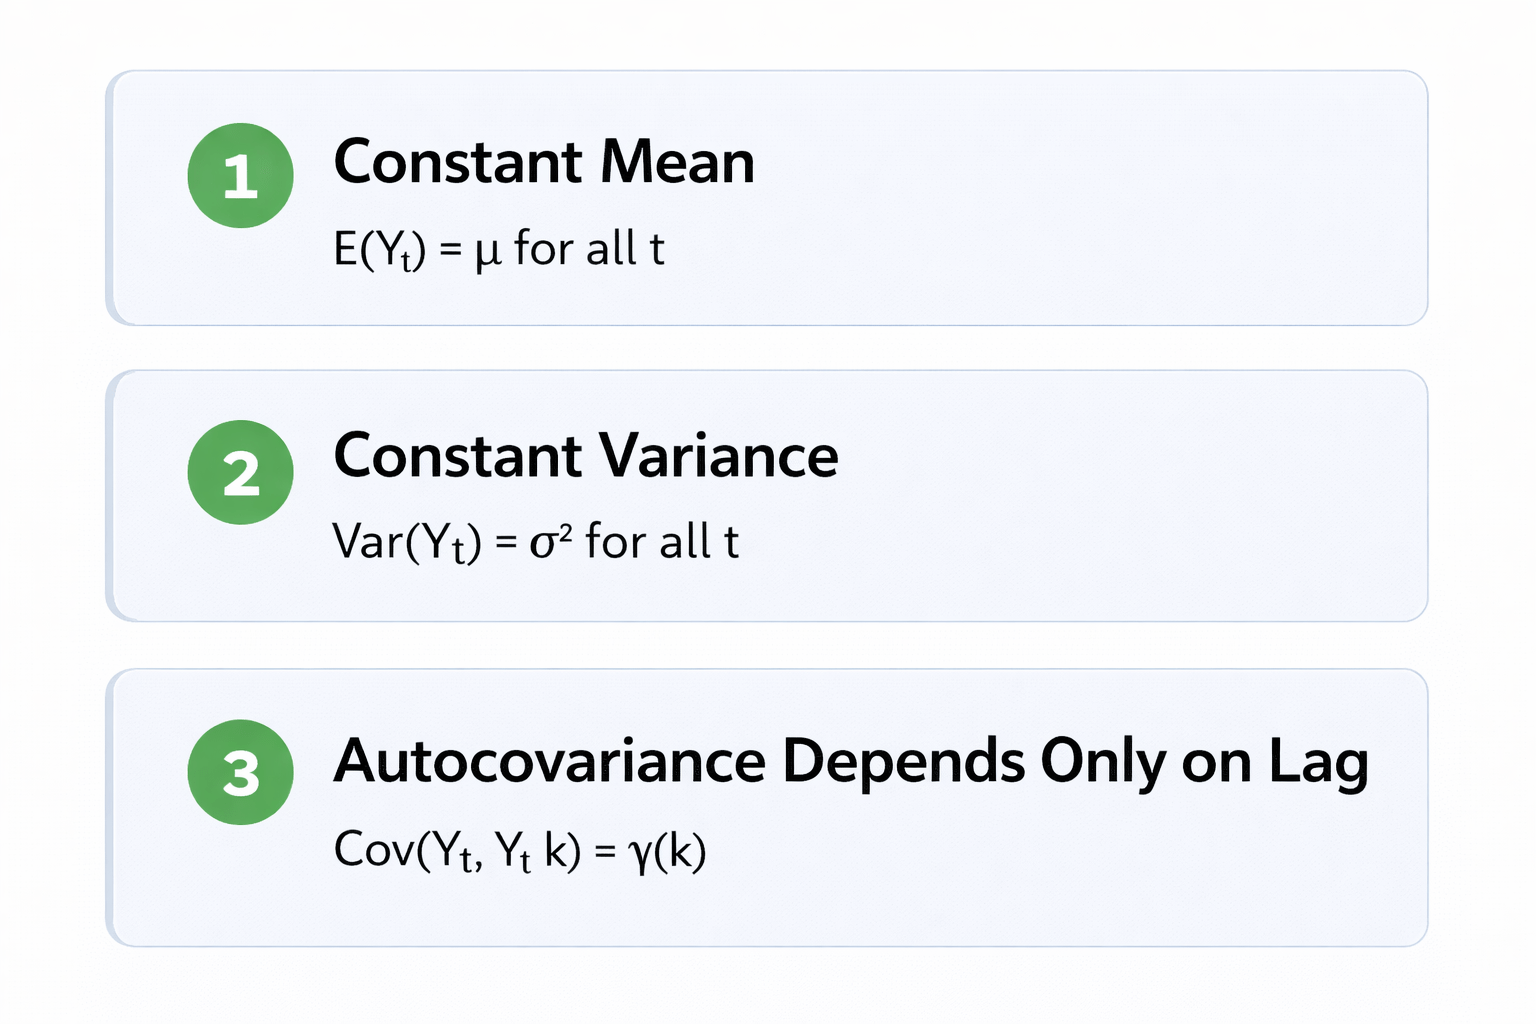
What is Stationarity?
A time series is stationary if its statistical properties do not change over time
Key properties:
- Constant Mean
- Constant Variance
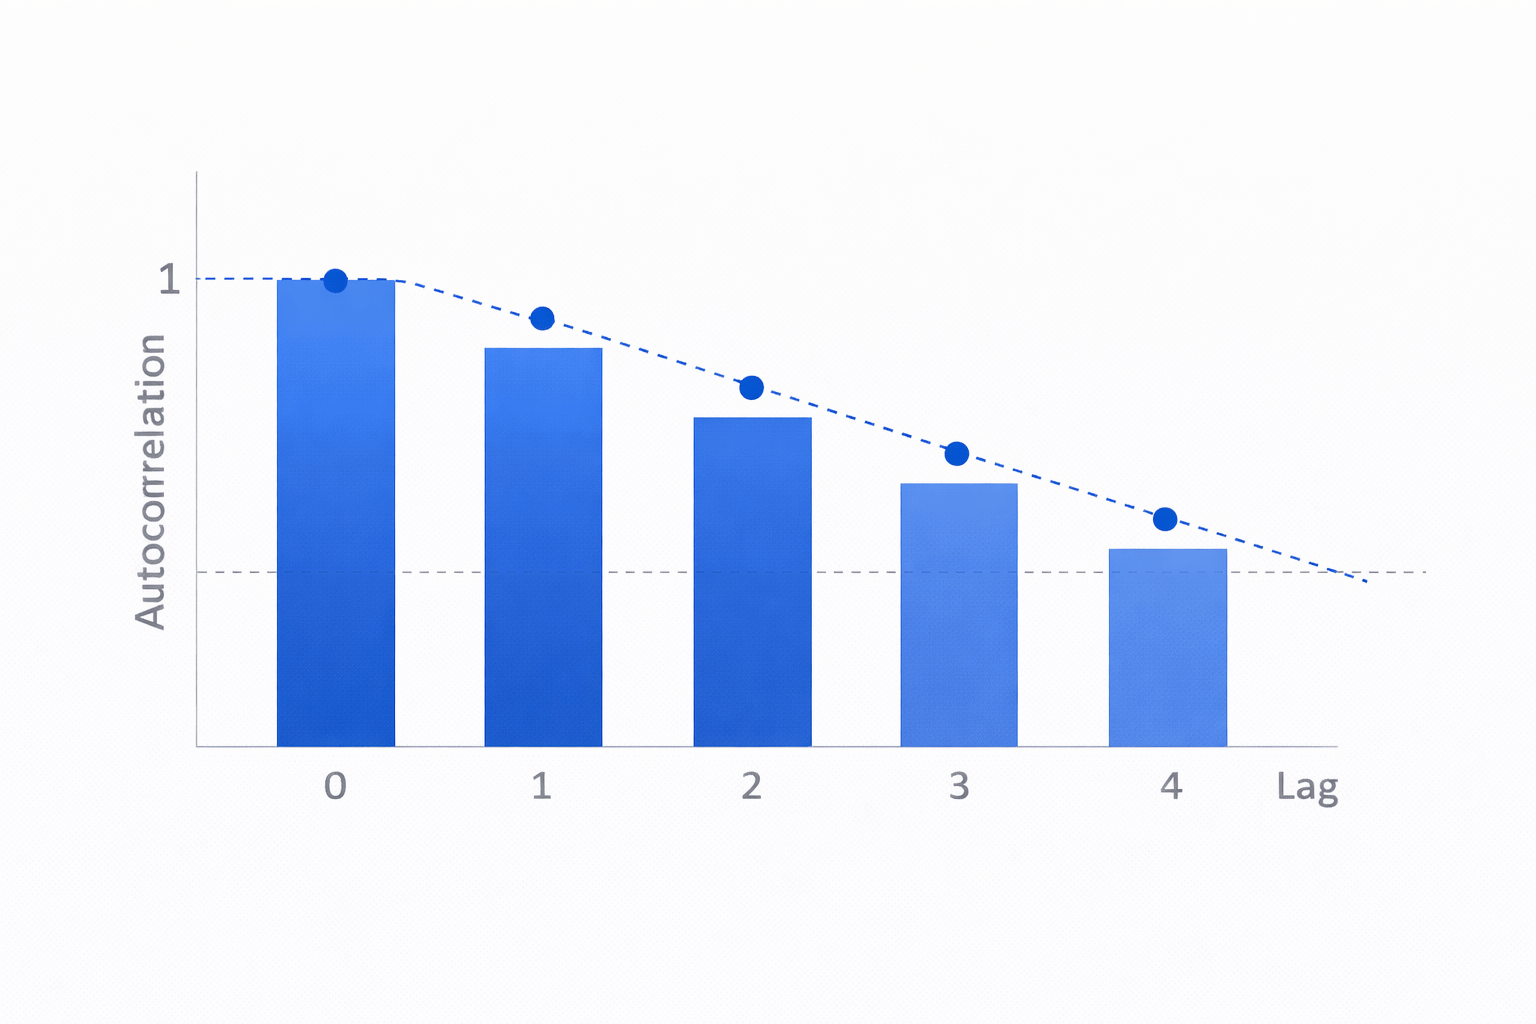
- Constant Autocovariance
Why Stationarity Matters
Most forecasting models assume stationarity
Examples:
AR
MA
ARMA
ARIMA
AutoRegressive
Moving Average
AR + MA Combined
Integrated ARMA
Without stationarity
Forecasts become unreliable

Types of Stationarity
Two main types:
Strict Stationarity
Weak (Covariance) Stationarity
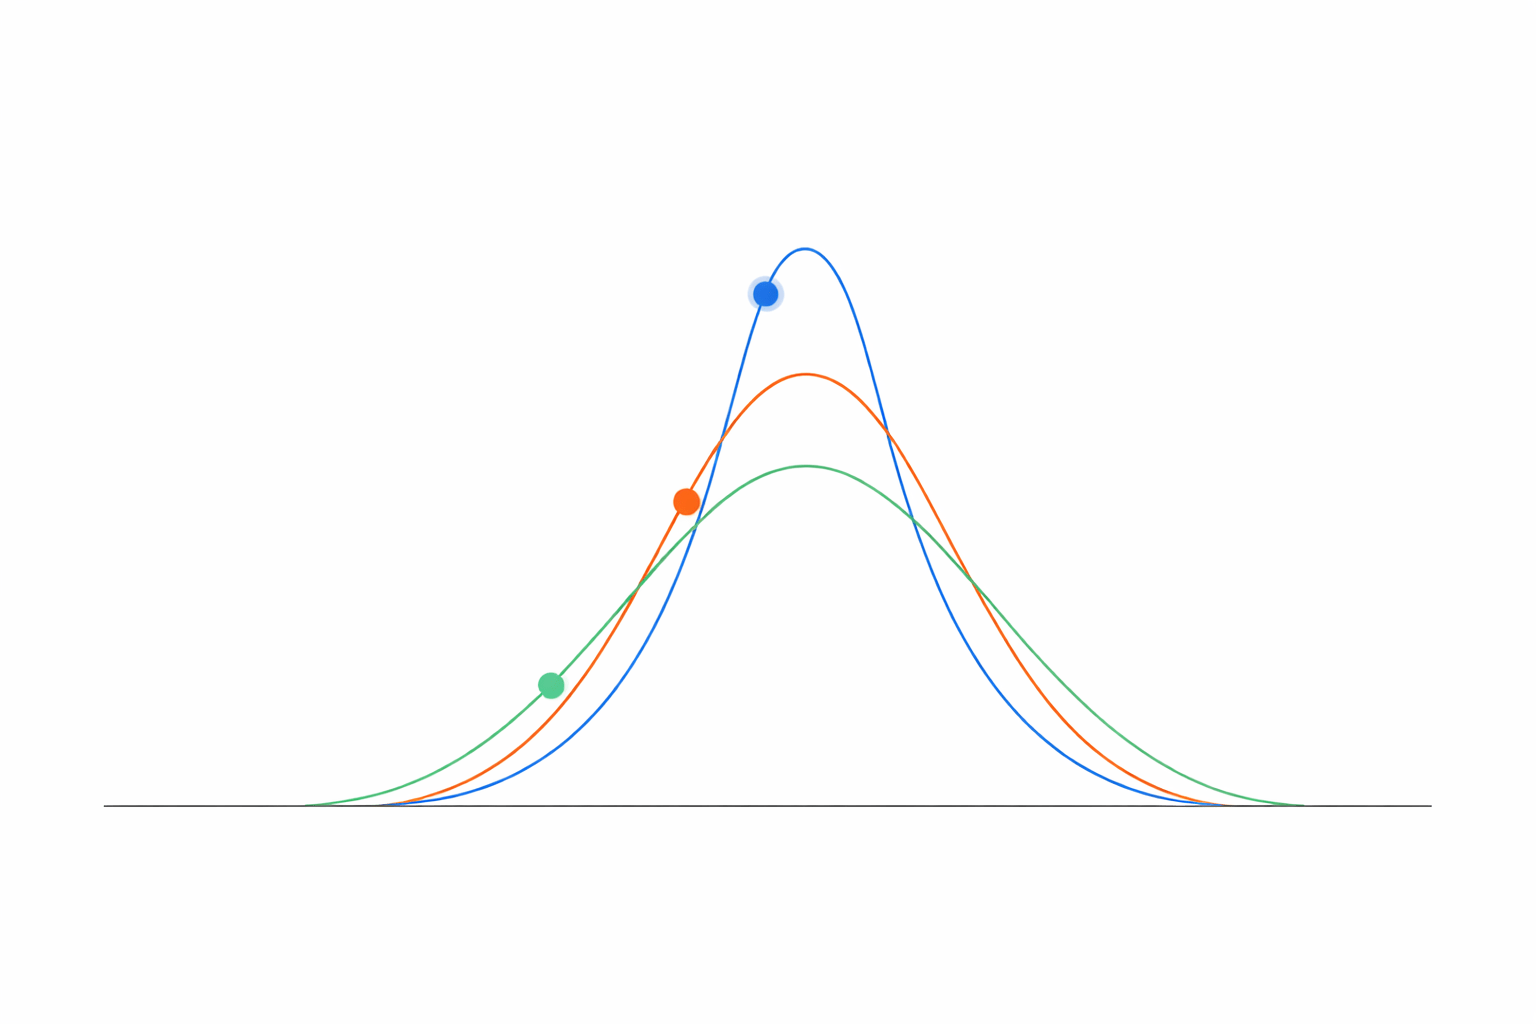
Strict Stationarity
Distribution remains identical at every time point
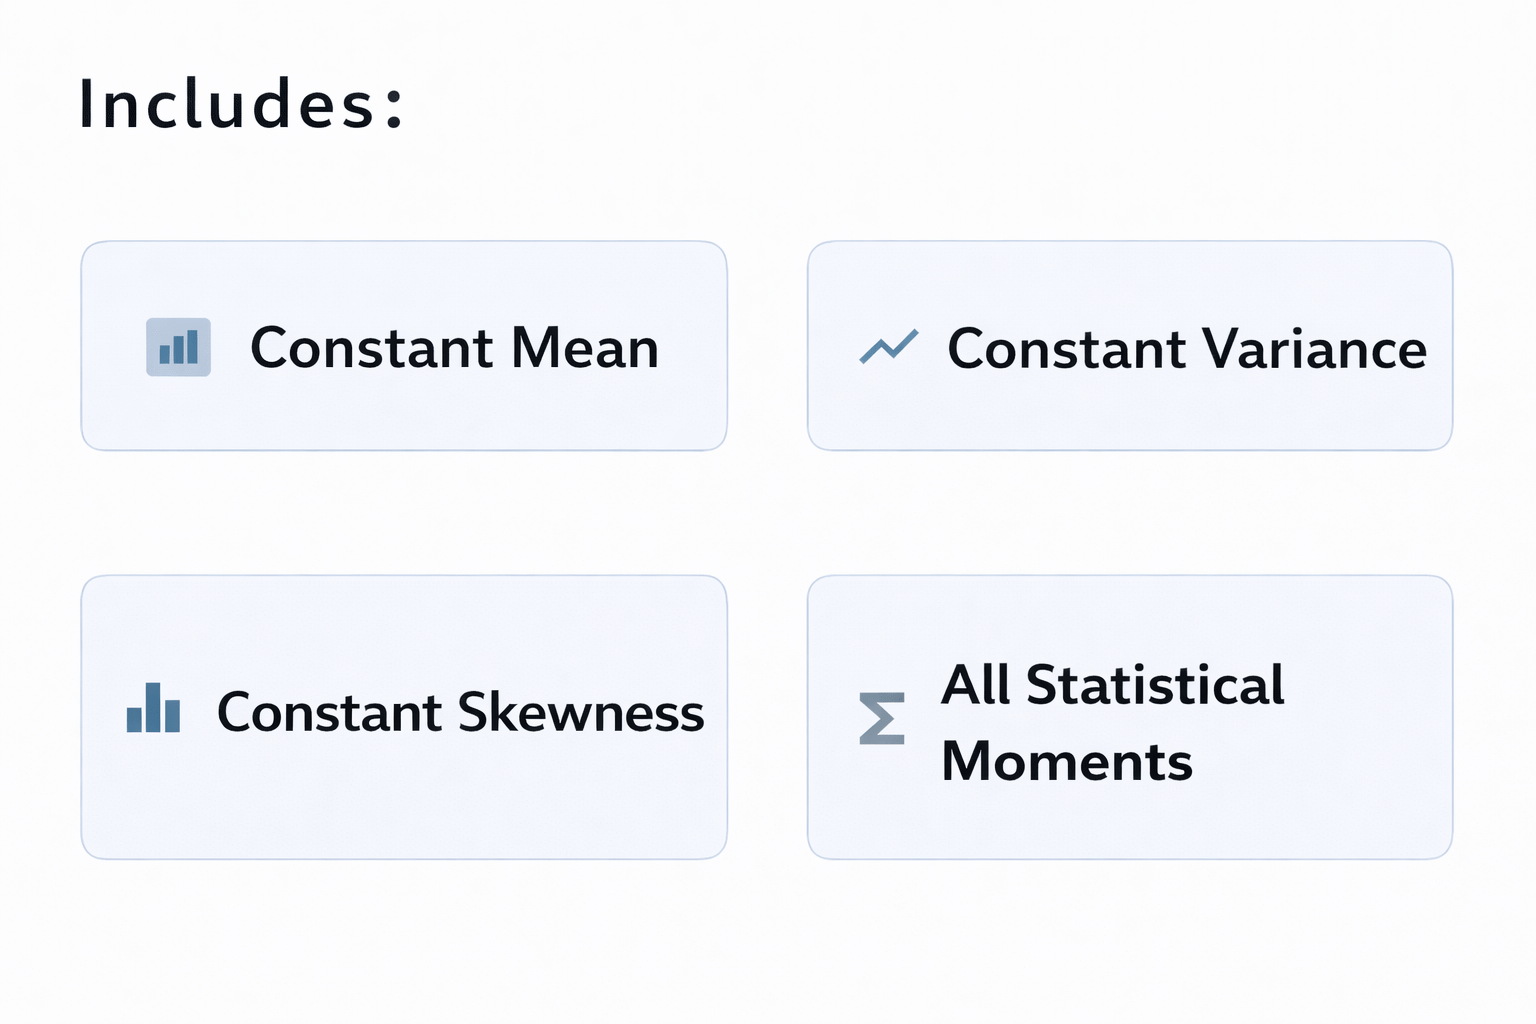
Rarely used in real-world modeling
Too restrictive for practical applications

Mean
Variance
Skewness
All statistical moments
Weak Stationarity
Three Conditions:
Used in most time series modeling

How to Check Stationarity
Three ways:
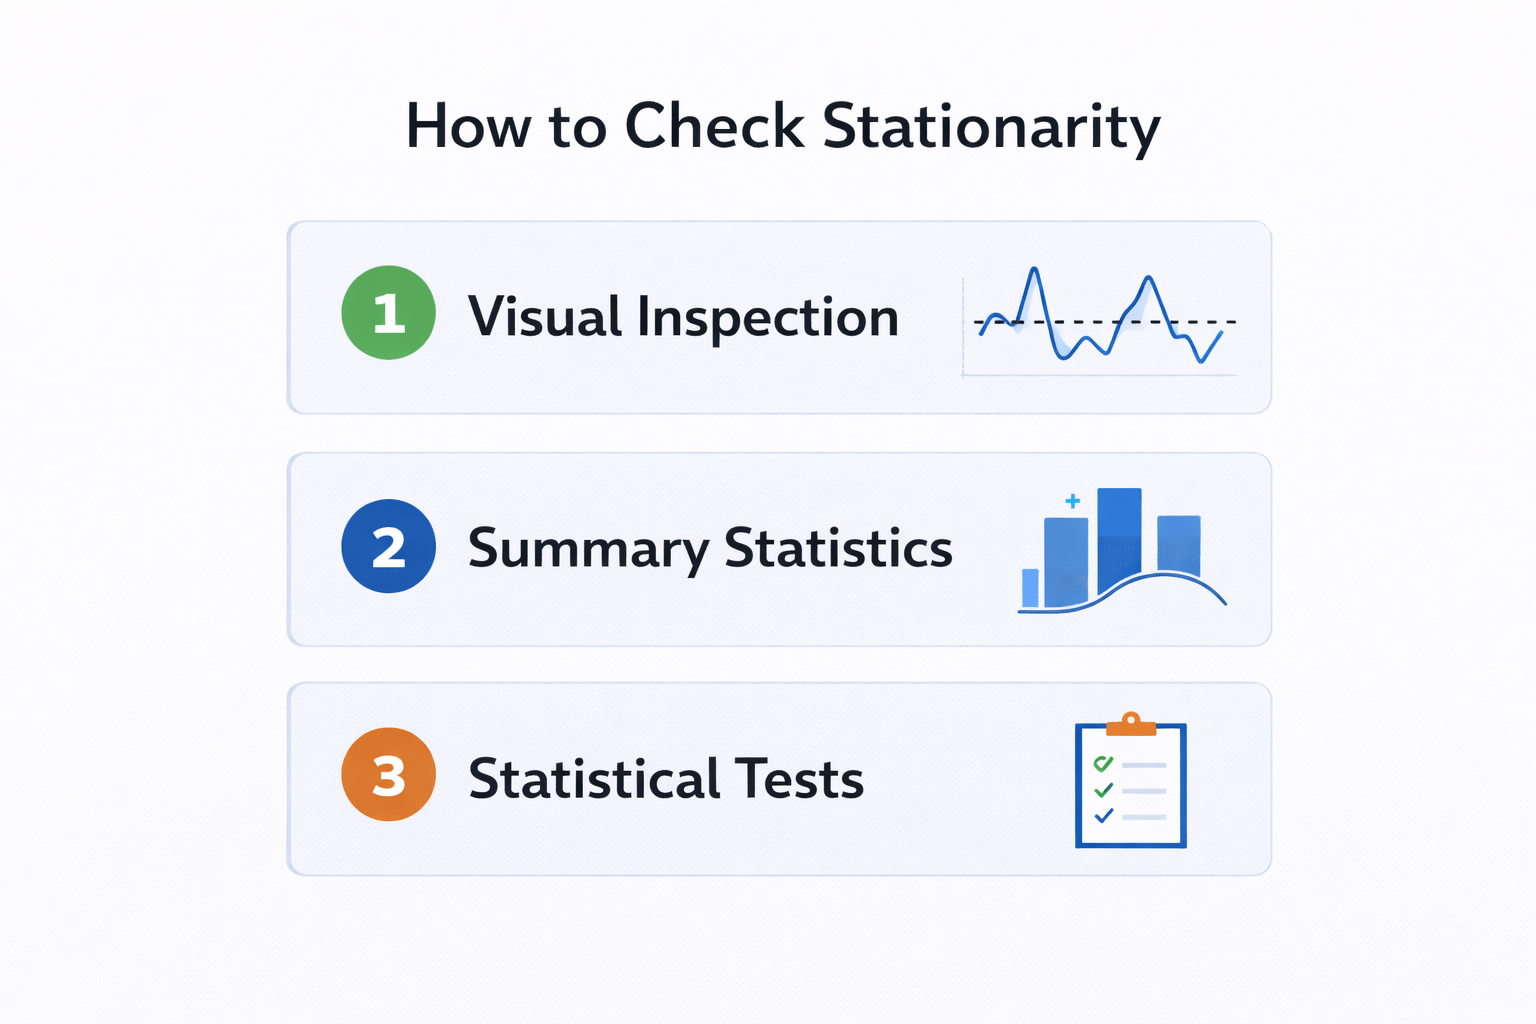
Visual Inspection
Plot the time series.
Check for:
Trend
Changing variance
Seasonality
Upward or downward movement over time
Spreads or narrows across time periods
Repeating patterns at regular intervals


If pattern shifts → Non-stationary
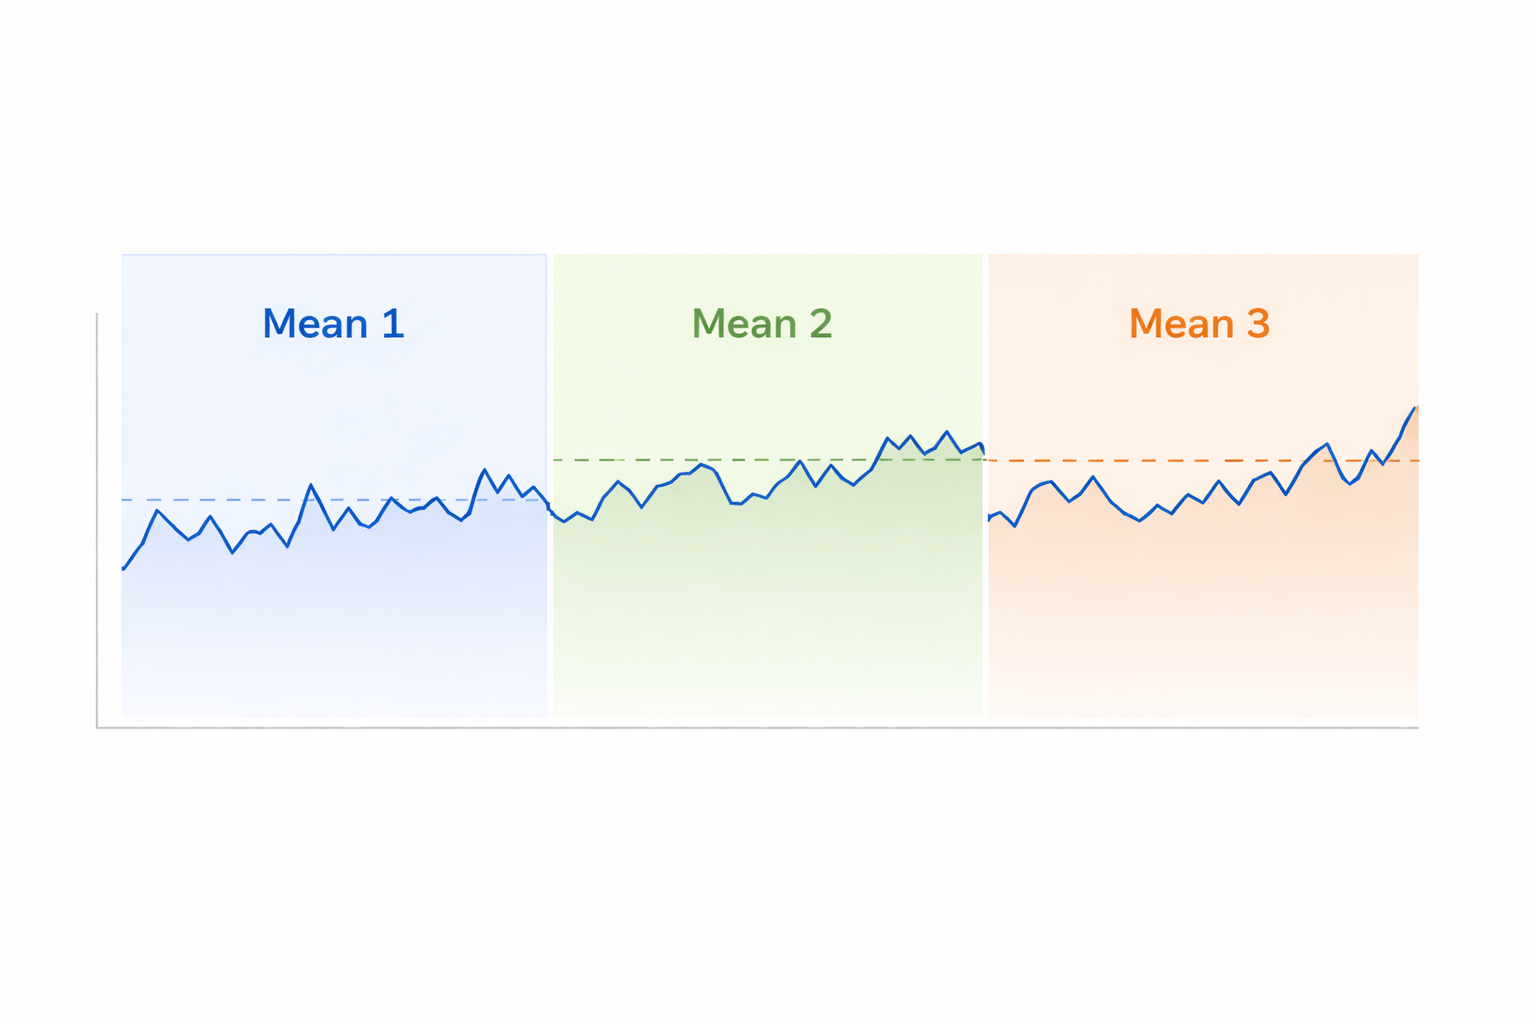
Summary Statistics Method
Divide data into segments.
Compare statistical measures across different time periods
Compare Mean
Calculate average for each segment
Compare Variance
Measure spread for each segment


If values change significantly → Non-stationary
Statistical Test (ADF Test)
Augmented Dickey-Fuller
Most common test for stationarity
Null Hypothesis
Alternative Hypothesis
Series is non-stationarya
Series is stationary
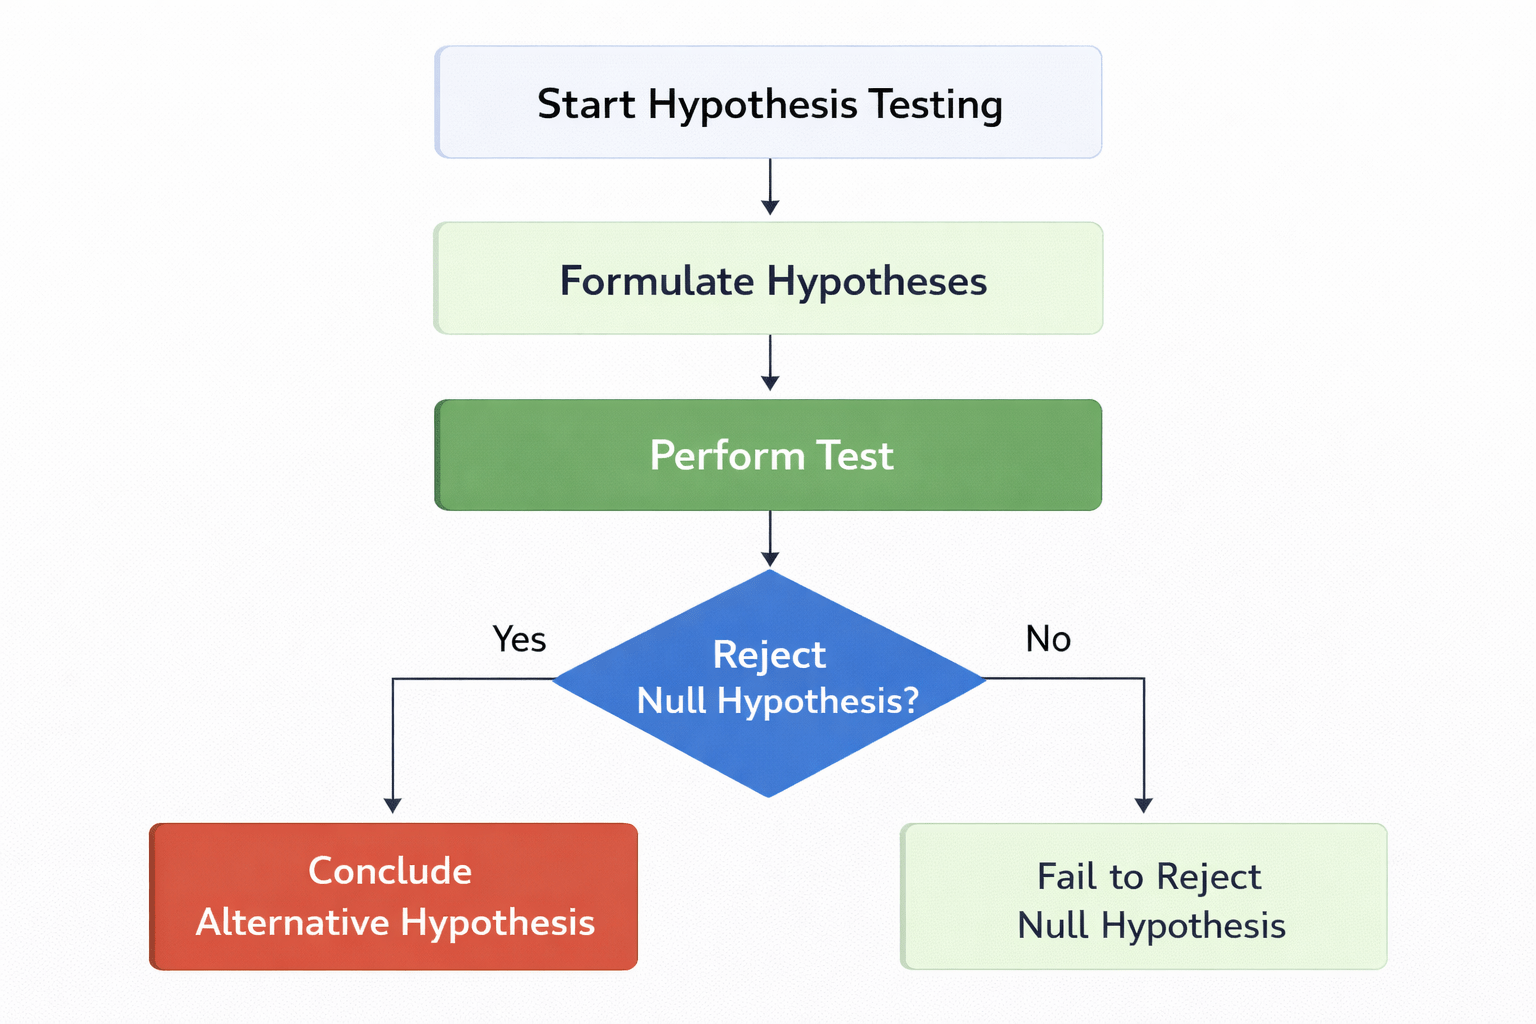
H₀
H₁
Decision rule:

p-value < 0.05
Stationary
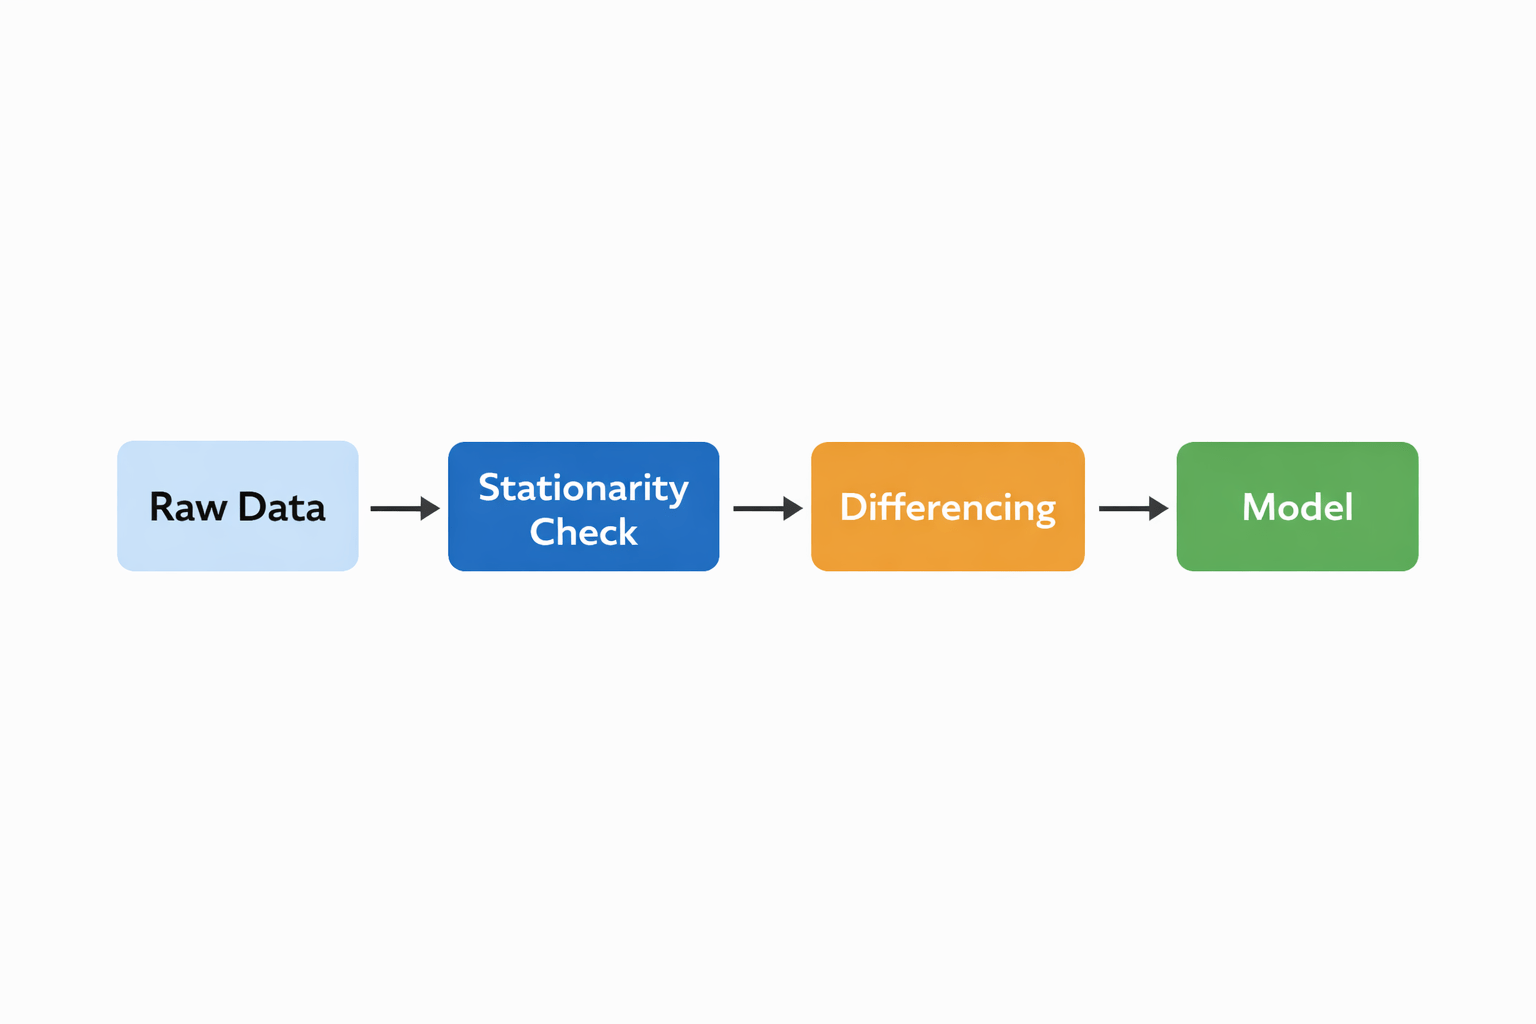
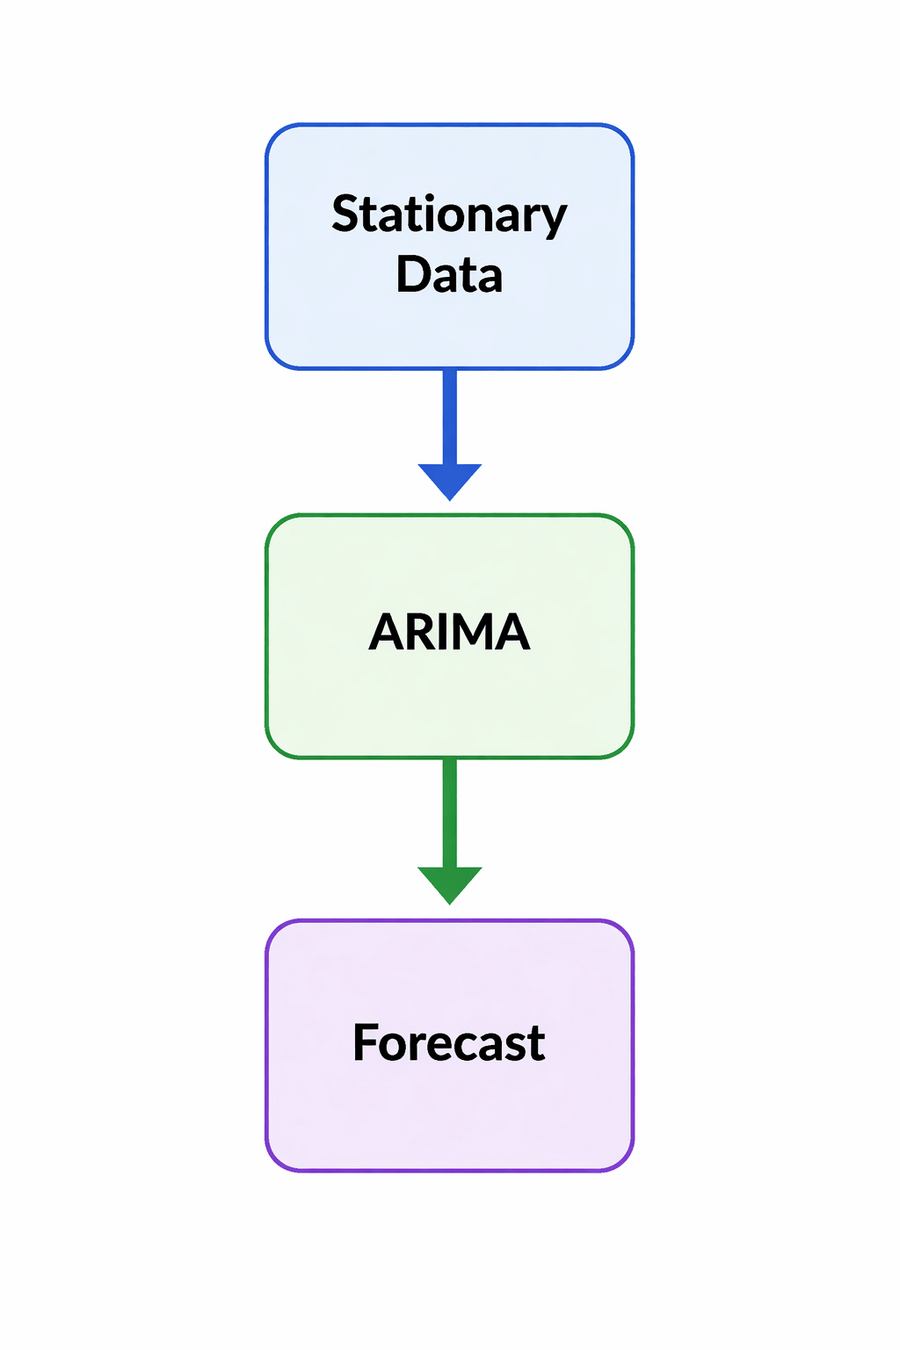
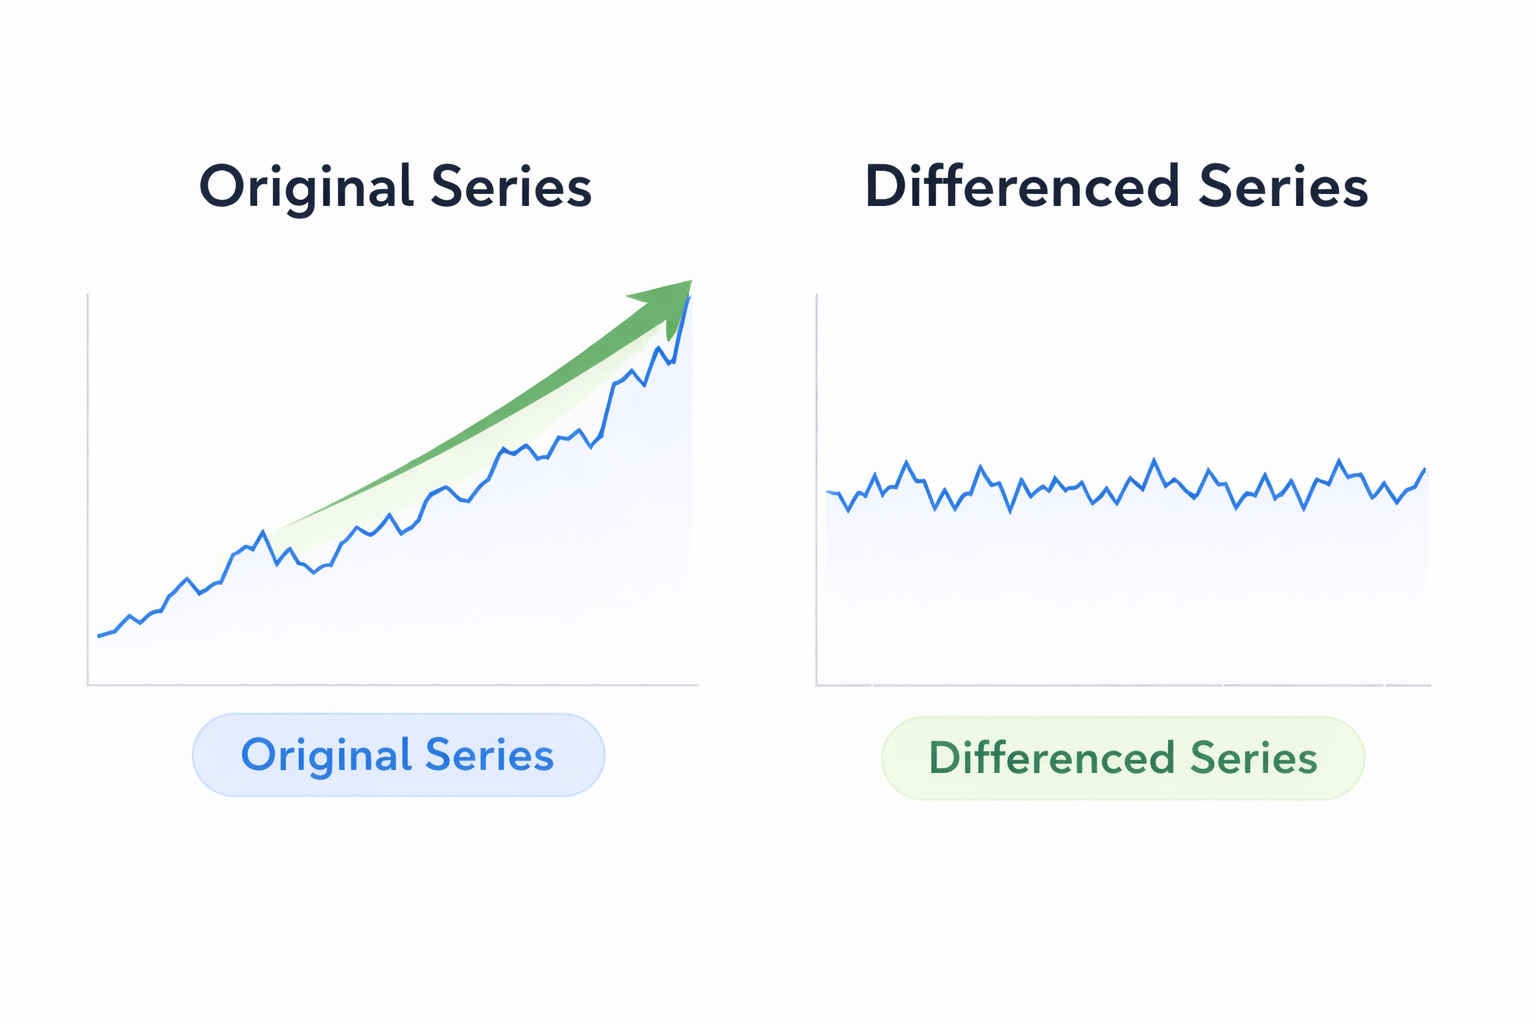
What is Differencing?
Removes Trend
Subtracts previous value from current value to achieve stationarity
Differencing removes trend from time series
Transformation Process
Used to convert non-stationary → stationary


First-Order Differencing
Removes Linear Trend
Subtracts consecutive observations to eliminate linear trends
Yt′=Yt−Yt−1Y'_t = Y_t - Y_{t-1}Yt′=Yt−Yt−1
Second-Order Differencing
- Used when trend still exists
Removes Quadratic Trend
Applied when first-order differencing is insufficient
Yt′′=Yt′−Yt−1′Y''_t = Y'_t - Y'_{t-1}Yt′′=Yt′−Yt−1′
Seasonal Differencing
Removes Seasonal Patterns
Eliminates repeating seasonal cycles from time series data
Y_t - Y_{t-s}
Monthly Data Example
s = 12 for annual seasonality

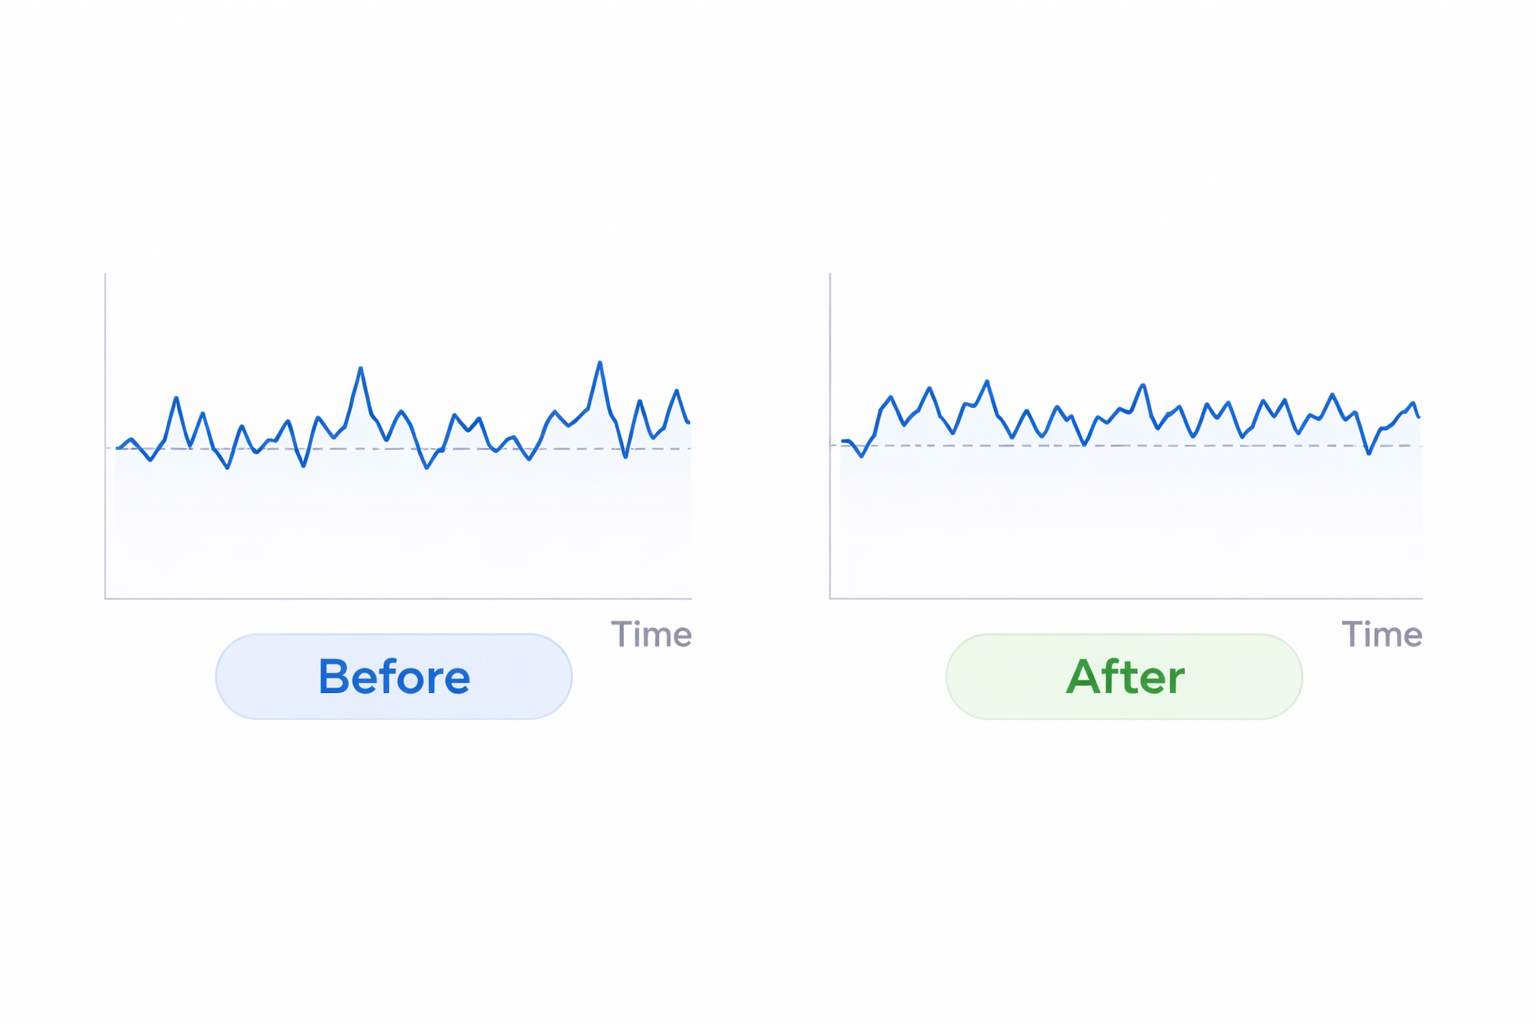
Before vs After Differencing
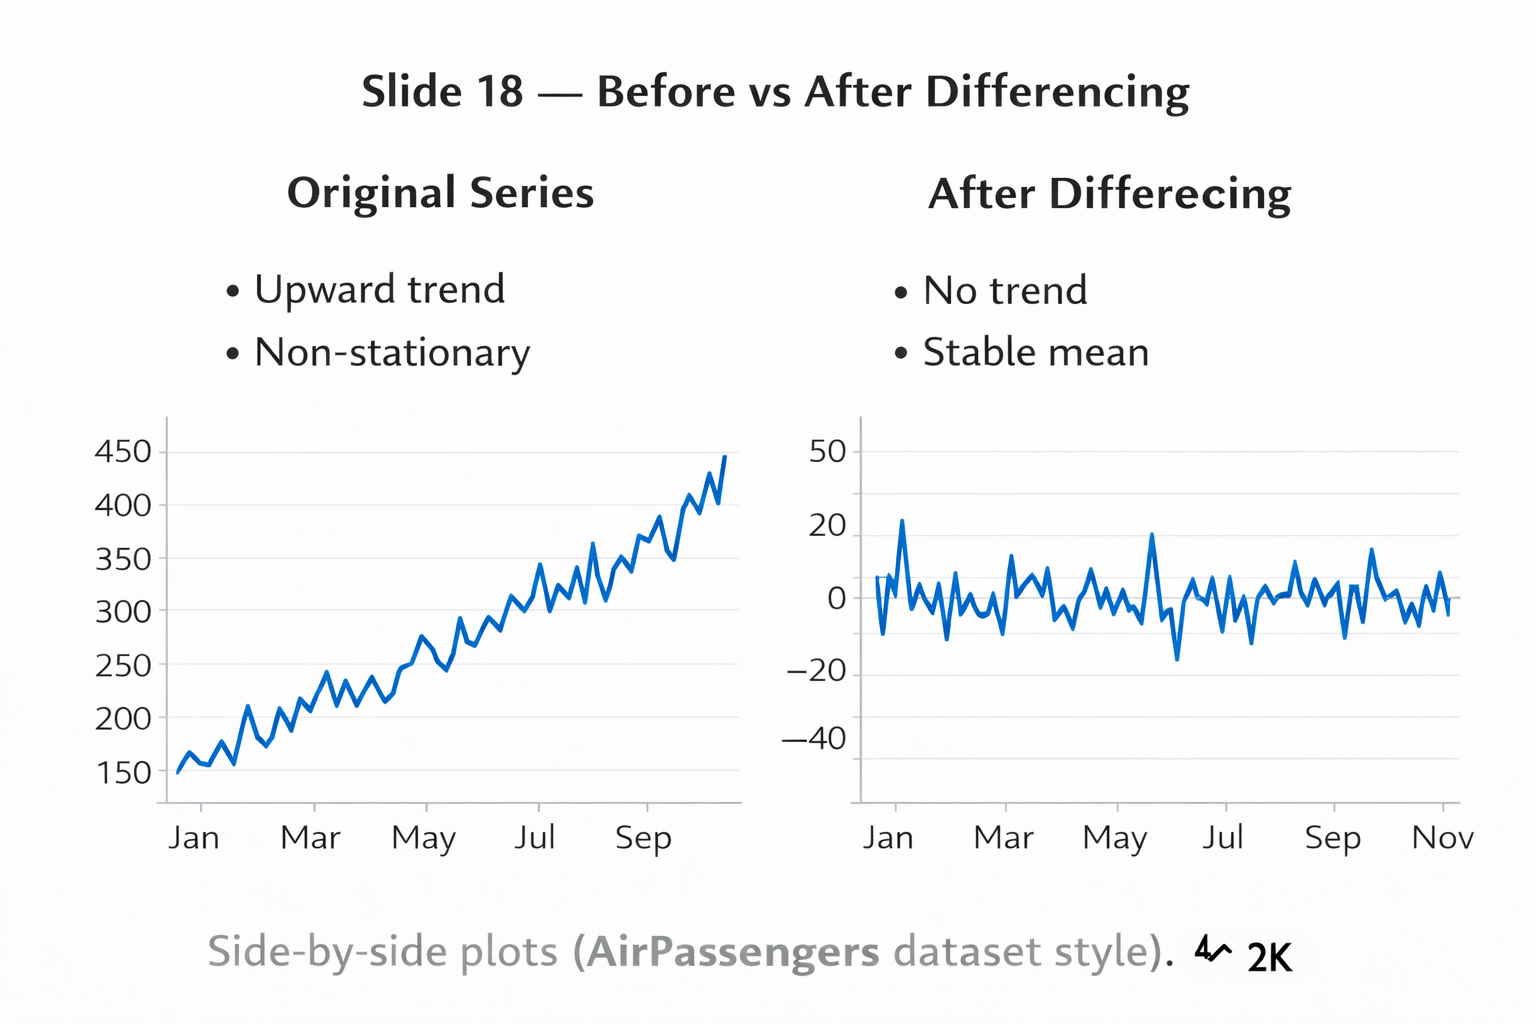
| Original Series | After Differencing |
|---|
| Upward trend | No trend |
| Non-stationary | Stable mean |
Summary
5
Proper preprocessing improves forecasting accuracy
4
Differencing removes trends from time series
3
Stationarity can be checked using visual inspection, statistics, and ADF test
2
Models like ARIMA require stationary data
1
Stationarity means statistical properties remain constant
Quiz
Which method is used to remove trend from a time series?
A. Normalization
B. Differencing
C. Standardization
D. Scaling

Quiz-Answer
Which method is used to remove trend from a time series?
A. Normalization
B. Differencing
C. Standardization
D. Scaling