


Content ITV PRO
This is Itvedant Content department
Learning Outcome
5
Understand how improper preparation distorts insights
4
Validate and prepare data before plotting
3
Apply essential data-cleaning steps using Pandas
2
Explain why data cleaning is required before insights
1
Define what raw data and insight-ready data mean
Previously covered topics established the downstream pipeline:
A business analyst receives raw sales logs from multiple branches...
But he faces issues such as:
Some transactions are missing values for amount or date
The same sale appears multiple times in the system
Branch names are inconsistent (e.g., “BLR”, “Bangalore”)
A few transactions show unrealistic values due to entry errors
If insights are extracted directly, totals are inflated, trends are incorrect, and comparisons are unreliable ?
What should one do in this case?
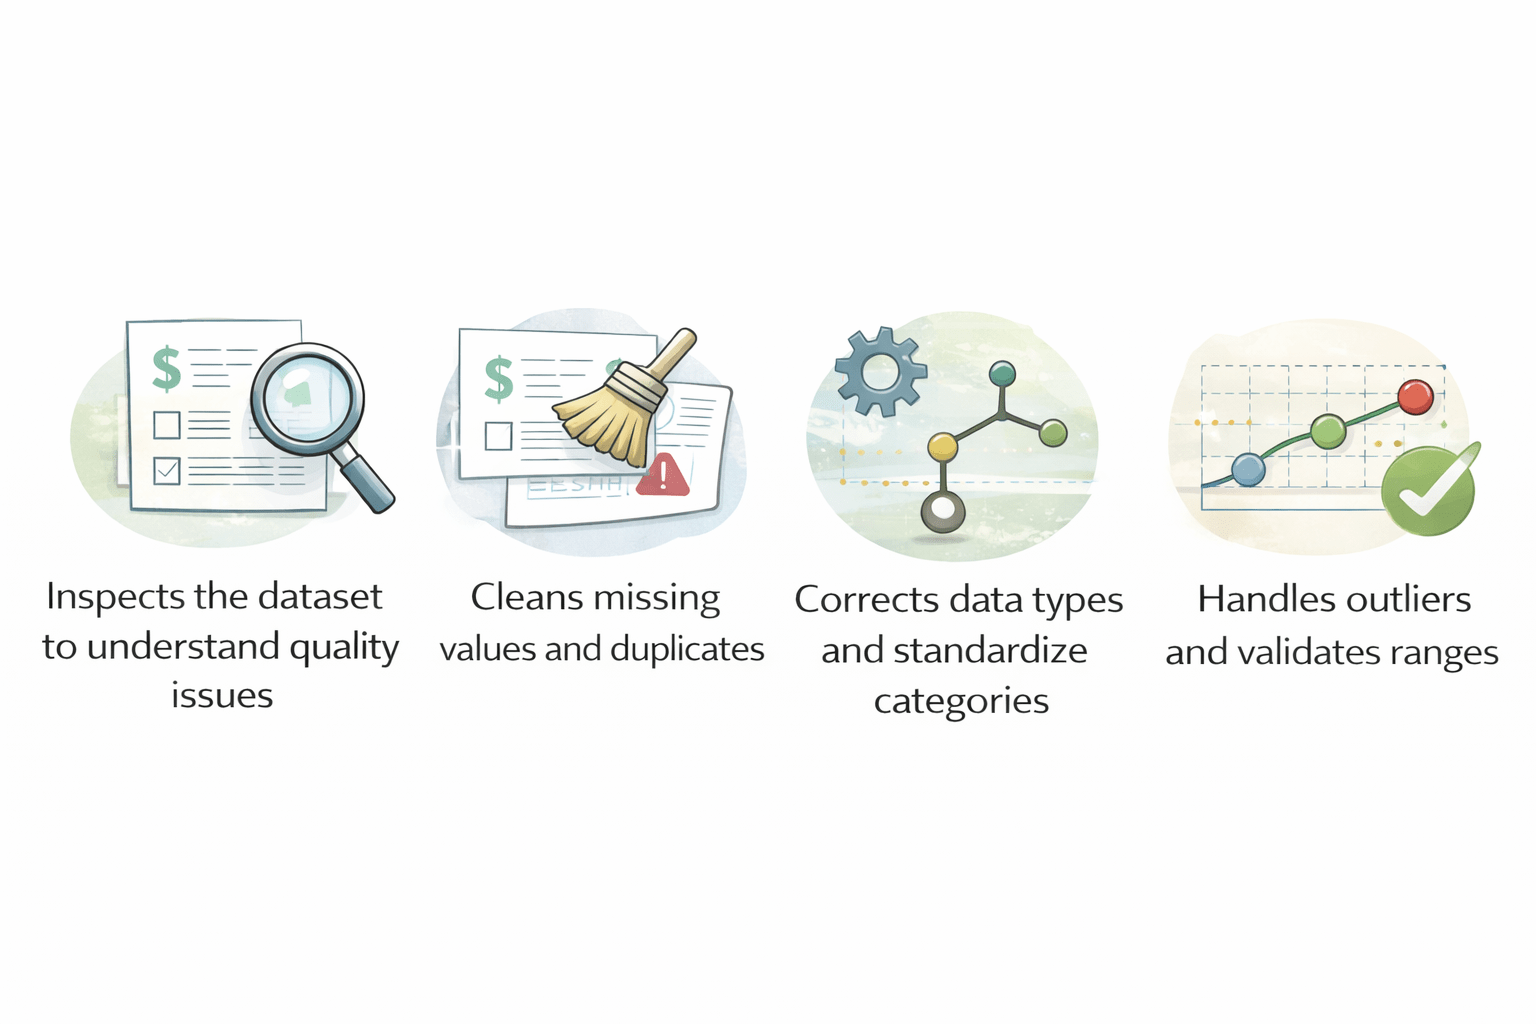
In such cases we need to....
Inspects the dataset to understand quality issues
Cleans missing values and duplicates
Corrects data types and standardizes categories
Handles outliers and validates ranges
Insights are not created by charts.
They are revealed by clean, validated, and correctly structured data.
Visualization only communicates what preparation allows
let's understand it in detail....
Difference between Raw Data & Insight-Ready Data
Insights depend on correct counts, ranges, categories, and timelines
Raw data violates these assumptions and leads to false patterns
| Unprocessed and unorganized |
| Contains errors, duplicates, noise |
| Difficult to read or analyse |
| Not directly useful for decisions |
| Cleaned and well-structured |
| Accurate and consistent |
| Easy to analyse and visualize |
| Supports insights and decision-making |
Raw Data
Insight-Ready Data
Inspection exposes missing values, duplicates, outliers, invalid dates, and inconsistent categories that would distort insights
Introduction to Data Inspection
Data inspection is the initial step of examining data to understand its structure, quality, and content before analysis
It involves:
Checking data types, formats, and ranges
Identifying missing values, errors, and duplicates
Spotting outliers or unusual patterns
Understanding overall data distribution
Why do we need it?
Missing values are absent or undefined data points represented as NaN in Pandas
Sample Dataset
import pandas as pd

df = pd.DataFrame({
    "Name": ["Amit", "Priya", "Rahul", "Amit", None],
    "Age": [25, None, 22, 25, 28],
    "Salary": [50000, 60000, None, 50000, 700000],
    "City": ["Delhi", "Mumbai", "mumbai", "Delhi", "Delhi"],
    "JoiningDate": ["2022-01-10", "2021-05-15", "not available", "2022-01-10", "2020-03-20"]
})
Identifying Missing Values
df.isnull().sum()Missing values break calculations, distort averages, and introduce gaps in visualizations
Handling Missing Values
Filling Missing Values
Filling missing values replaces absent data with statistically reasonable estimates
df["Age"].fillna(df["Age"].mean(), inplace=True)
df["Salary"].fillna(df["Salary"].median(), inplace=True)
Preserves dataset size while maintaining numerical balance
Dropping Missing Values
Dropping missing values removes incomplete records when estimation would be unreliable
df.dropna(inplace=True)Ensures insights are based only on complete and trustworthy records
Removing Duplicate Records
Duplicate records are repeated rows representing the same real-world entity more than once
How to handle duplicate records:
df.drop_duplicates(inplace=True)Why duplicates must be removed before insights?
Duplicates inflate counts, totals, and bar heights, producing biased insights
Fixing Data Types
Data types define how values are stored and interpreted (numeric, categorical, datetime)
How to inspect Data Types:
df.dtypesWhy correct data types?
Incorrect types break sorting, grouping, time analysis, and plotting
Impact on insights:
Enables correct ordering, grouping, resampling, and time-based trends
Numeric Conversion
Numeric conversion ensures values behave correctly in calculations
df["Age"] = pd.to_numeric(df["Age"], errors="coerce")
df["Salary"] = pd.to_numeric(df["Salary"], errors="coerce")
Datetime Conversion
Datetime conversion transforms date-like text into time-aware objects
df["JoiningDate"] = pd.to_datetime(df["JoiningDate"], errors="coerce")Handling Outliers
Outliers are extreme values that differ significantly from the majority of observations
Why outliers must be handled before insights?
Outliers stretch axes, hide patterns, and mislead trend interpretation
How to handle them:
import numpy as np

mean = df["Salary"].mean()
std = df["Salary"].std()
df = df[df["Salary"] < mean + 3 * std]
Standardizing Categories & Data Validation
Outliers are extreme values that differ significantly from the majority of observations
Prevents fragmented categories and ensures accurate grouping
Standardizing Categories:
df["City"] = df["City"].str.lower().str.strip()Data Validation:
Data validation is the process of verifying that cleaned data behaves as expected
df.describe()Confirms ranges, distributions, and logical consistency before interpretation
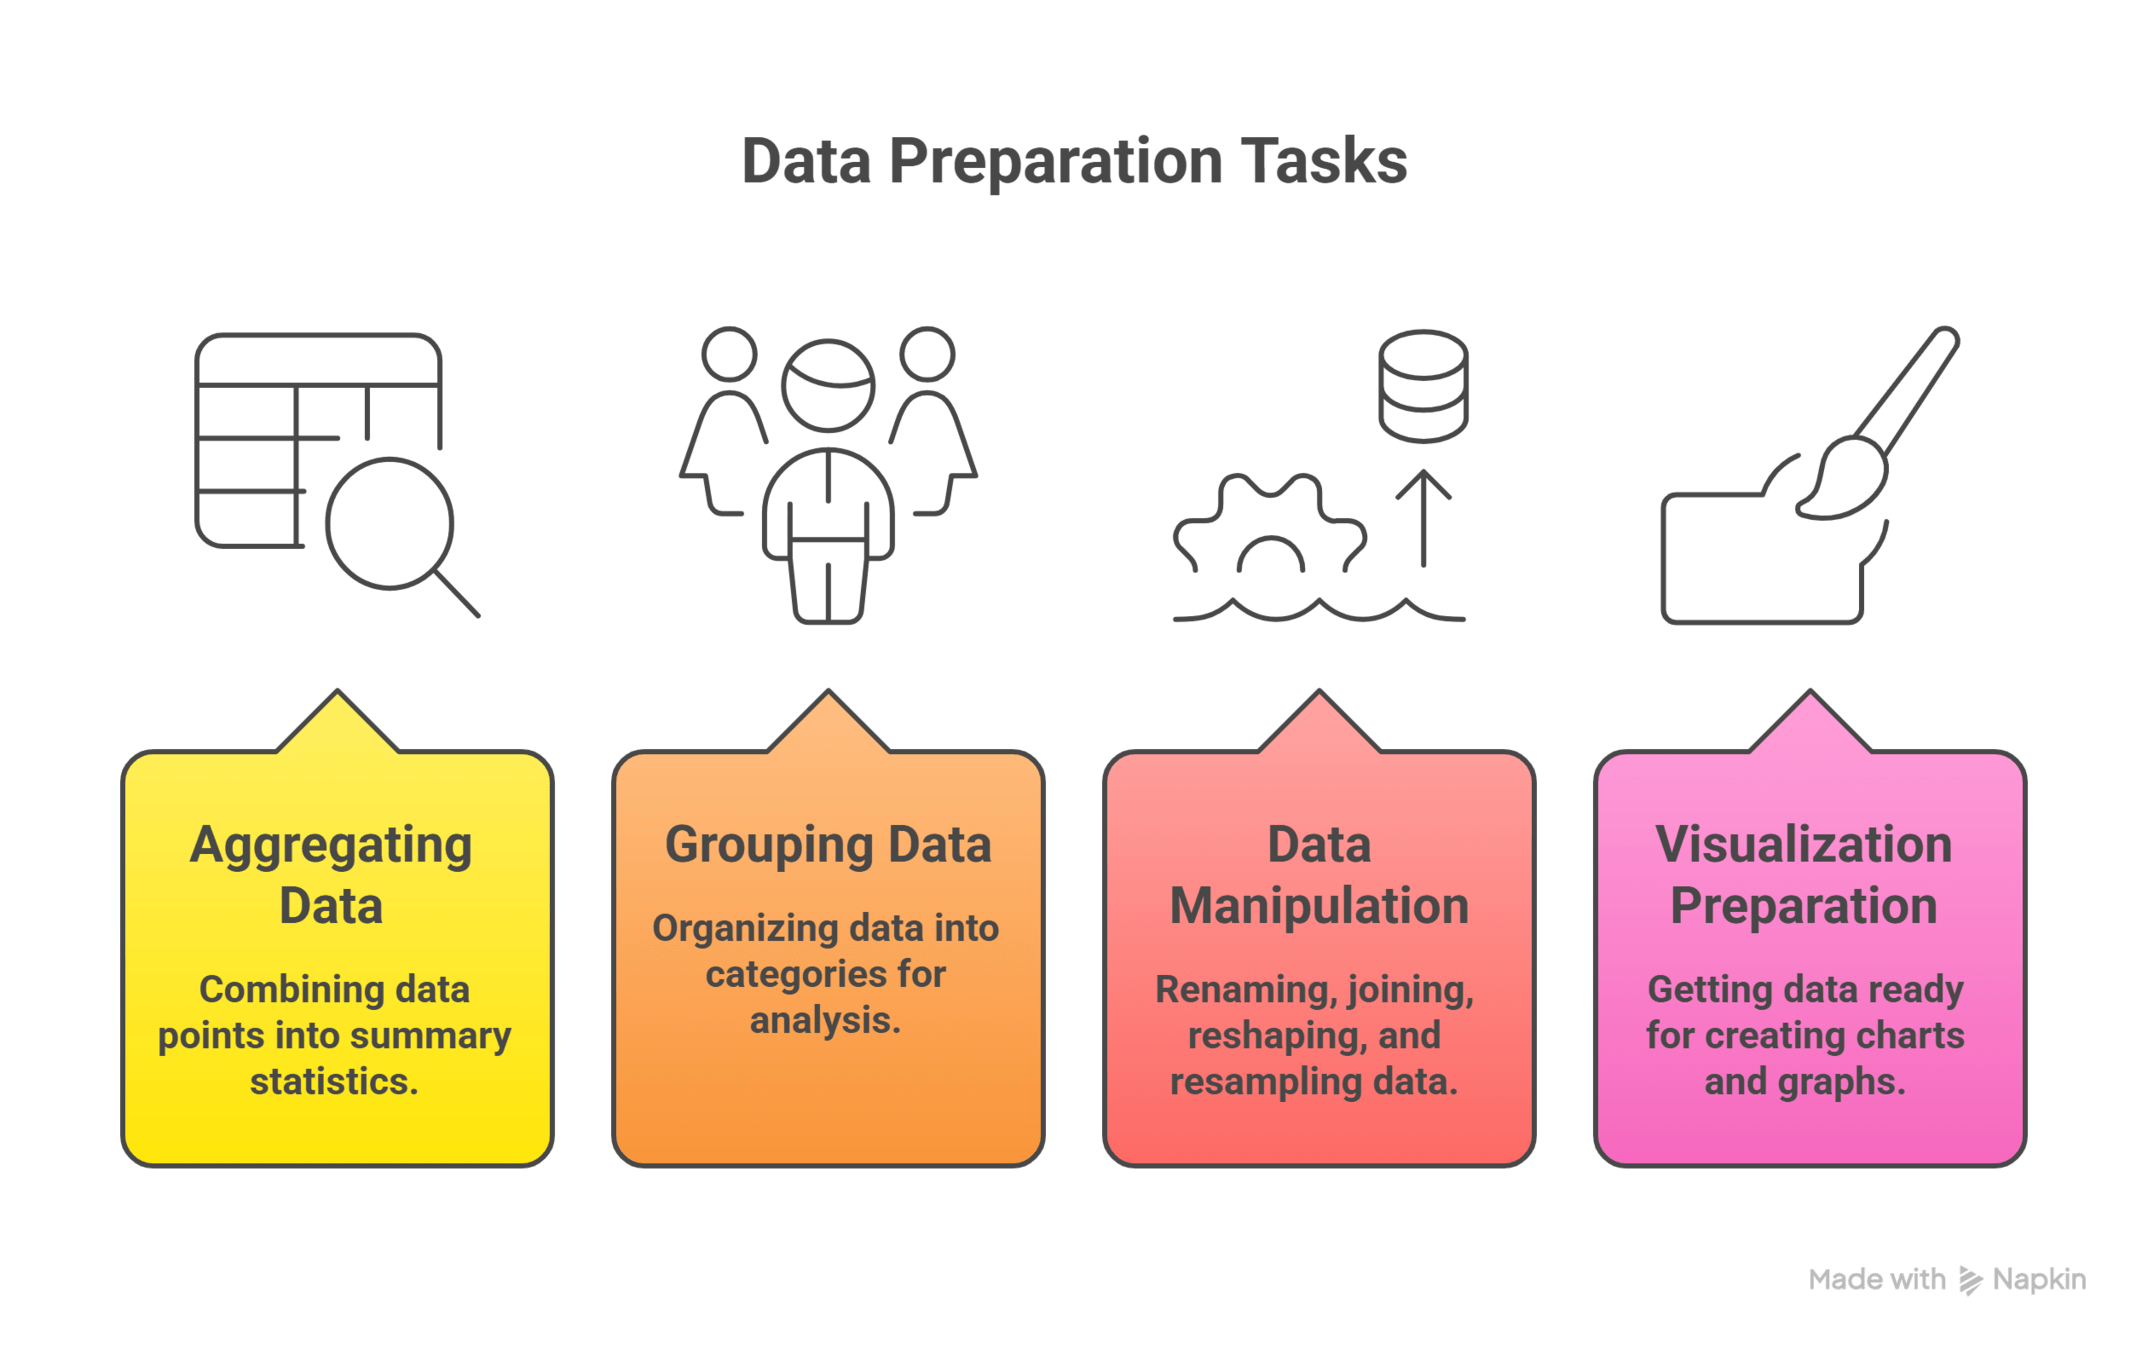
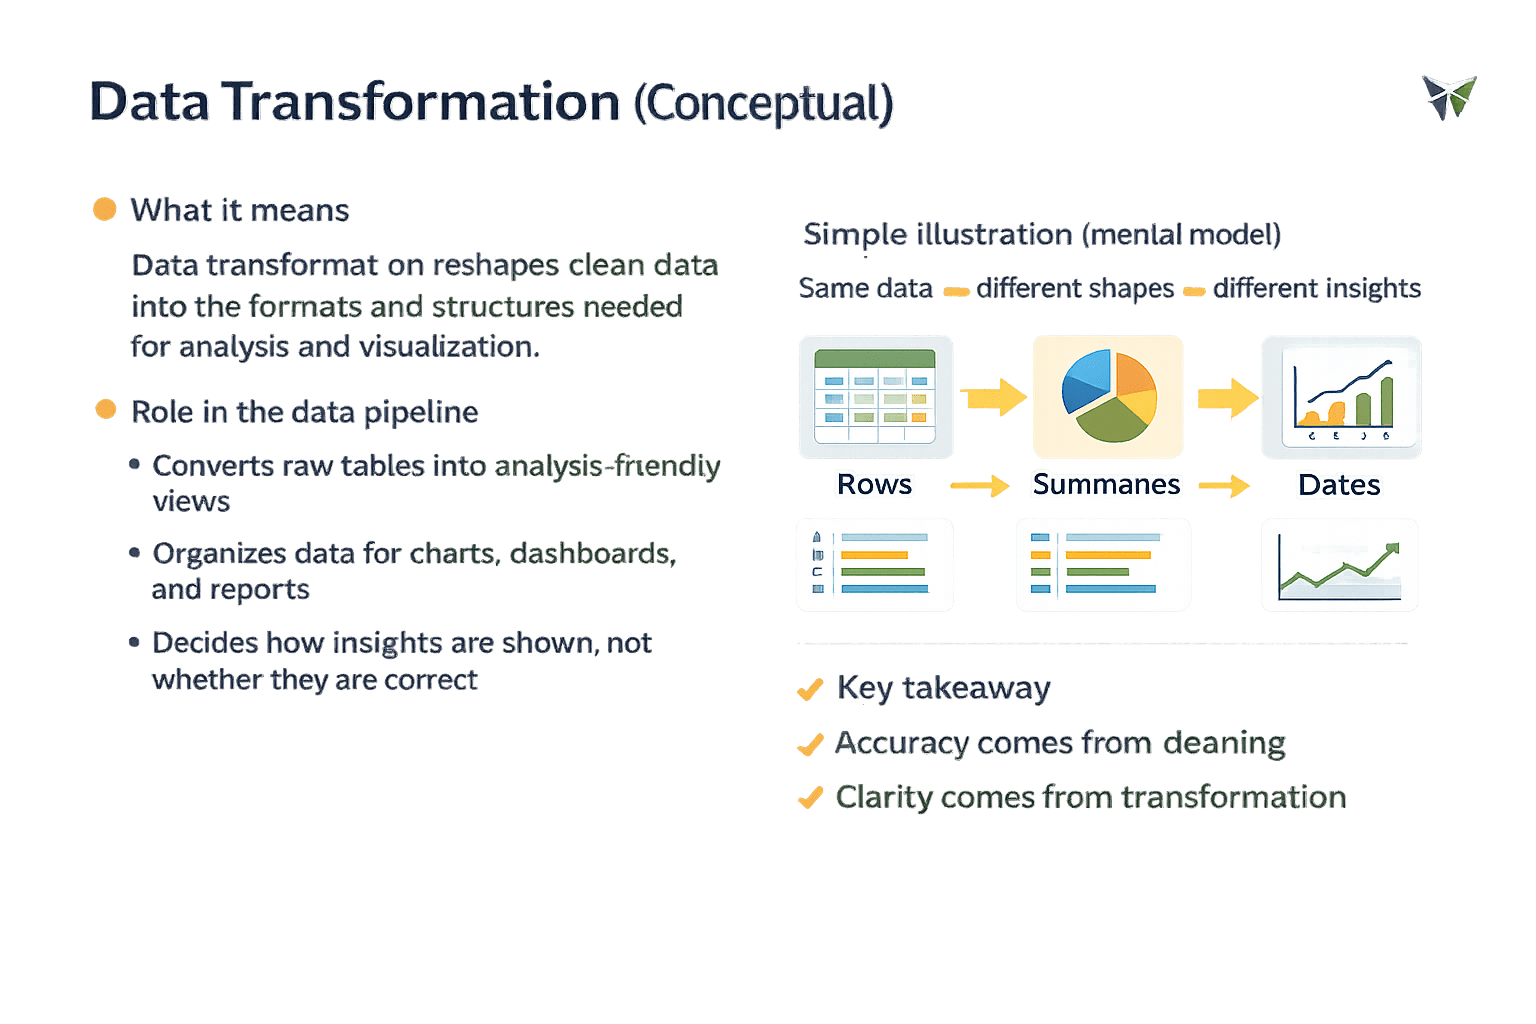
Data Transformation
What it means?
Data transformation reshapes clean data into the formats and structures needed for analysis and visualization
Transformation prepares how insights are expressed, not whether they are correct
Same Data
Different insights
Different Shapes
Accuracy comes from cleaning , clarity comes from transformation
Creating Plots Using Pandas
Data visualization is the process of graphically representing validated and prepared data to communicate insights clearly and accurately
Why plotting comes after preparation and insights?
Plotting assumes complete and accurate values
It requires consistent categories and valid numeric ranges
Time-based plots need correctly ordered data
Poor preparation leads to misleading visuals
Incorrect plots appear confident but statistically wrong
1
2
3
4
5
Pandas plotting is a quick way to validate data and confirm trends, not for decorative visuals
It provides built-in plotting as a convenience layer:
Quickly validates prepared data visually
Helps verify trends before advanced visualization
Enables rapid exploratory checks
Pandas plotting is ideal for confirmation, not decoration
Role of Pandas in plotting
Bar Plot – Category Distribution
This plot shows the relative frequency of categories and their distribution across groups
df["City"].value_counts().plot(
    kind="bar",
    title="Employees by City"
)
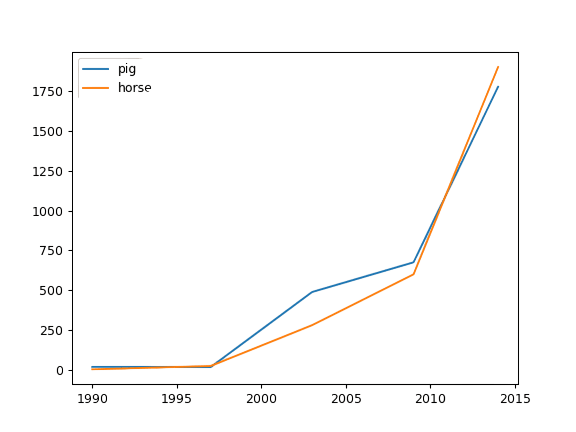
Line Plot – Trend Over Time
This plot shows how values change over time, highlighting their direction and rate of movement.
df.sort_values("JoiningDate").plot(
x="JoiningDate",
y="Salary",
kind="line",
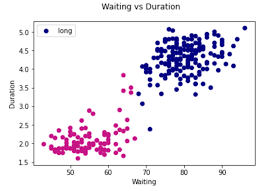
title="Salary Trend Over Time")Scatter Plot – Relationship Between Variables
df.plot(
    kind="scatter",
    x="Age",
    y="Salary",
    title="Age vs Salary"
)
This plot shows the relationship between two numerical variables, highlighting spread and clustering patterns.
Key limitation of Pandas plots:
Limited styling and customization
Not suitable for presentation-quality visuals
Basic support for complex charts
Data Journey from Raw Data to Insights
Data collection
Data cleaning
Data validation
Data transformation
Insight extraction
Visualization
5
Visualization communicates prepared insights
4
Validation ensures trust
3
Datetime and numeric correctness are essential
2
Each cleaning step protects analytical accuracy
1
Raw data must be cleaned before insights
Summary
Quiz
Why is datetime conversion critical before time-based analysis?
A. To reduce memory usage
B. To enable correct ordering and grouping
C. To remove outliers
D. To standardize text
Quiz-Answer
Why is datetime conversion critical before time-based analysis?
A. To reduce memory usage
B. To enable correct ordering and grouping
C. To remove outliers
D. To standardize text
By Content ITV


