


Content ITV PRO
This is Itvedant Content department
Learning Outcome
5
Differentiate linkage methods.
4
Find optimal number of clusters.
3
Interpret dendrograms.
2
Understand Agglomerative clustering process.
1
Compare Hierarchical Clustering with K-Means.
K-Means is fast — but it has a critical blind spot: you must blindly guess K before the algorithm even starts.
The Problem
What if you have no idea how many groups exist? Guessing wrong destroys the data's natural structure.
The Solution
We need an algorithm that maps the entire dataset first — and lets us choose K after seeing the full picture.
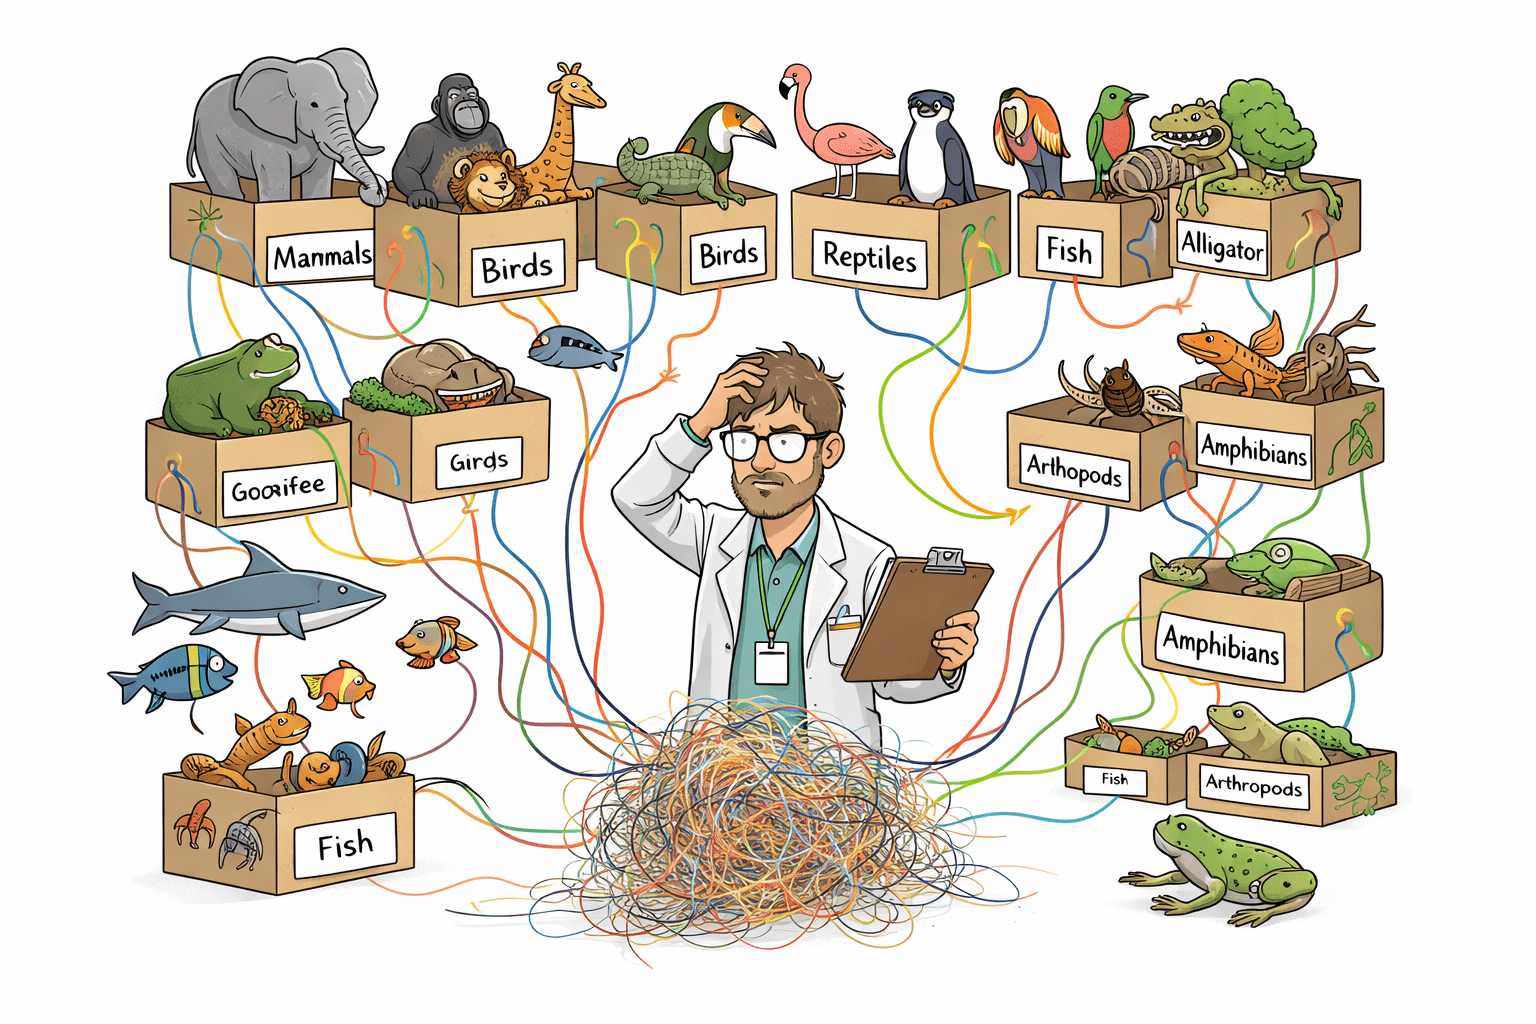
Imagine you are a biologist trying to organize every animal on Earth.
This is Agglomerative (Bottom-Up) Clustering. We treat every data point as its own cluster, and continuously merge the closest pairs until only one massive cluster remains.
Step 1 :
You start with every animal alone. A wolf is a wolf. A dog is a dog.
You find the two most similar animals (Wolf and Dog) and merge them into a single "Canine" cluster.
Step 2 :
You merge Canines and Felines into "Mammals". You repeat this until every living thing is grouped under one giant label: "Animals".
Step 4 :
You find the next closest groups. You merge Lions and Tigers into "Felines".
Step 3 :
The Agglomerative Dance
The Loop:
01
Calculate distances
Measure distance between all existing clusters.
02
Find the closest pair
Identify the two clusters nearest to each other.
03
Merge them
Combine into one larger cluster.
04
Repeat
Continue until only 1 giant cluster remains.
Once two points are merged, they can never be separated. The algorithm has no "undo" button.
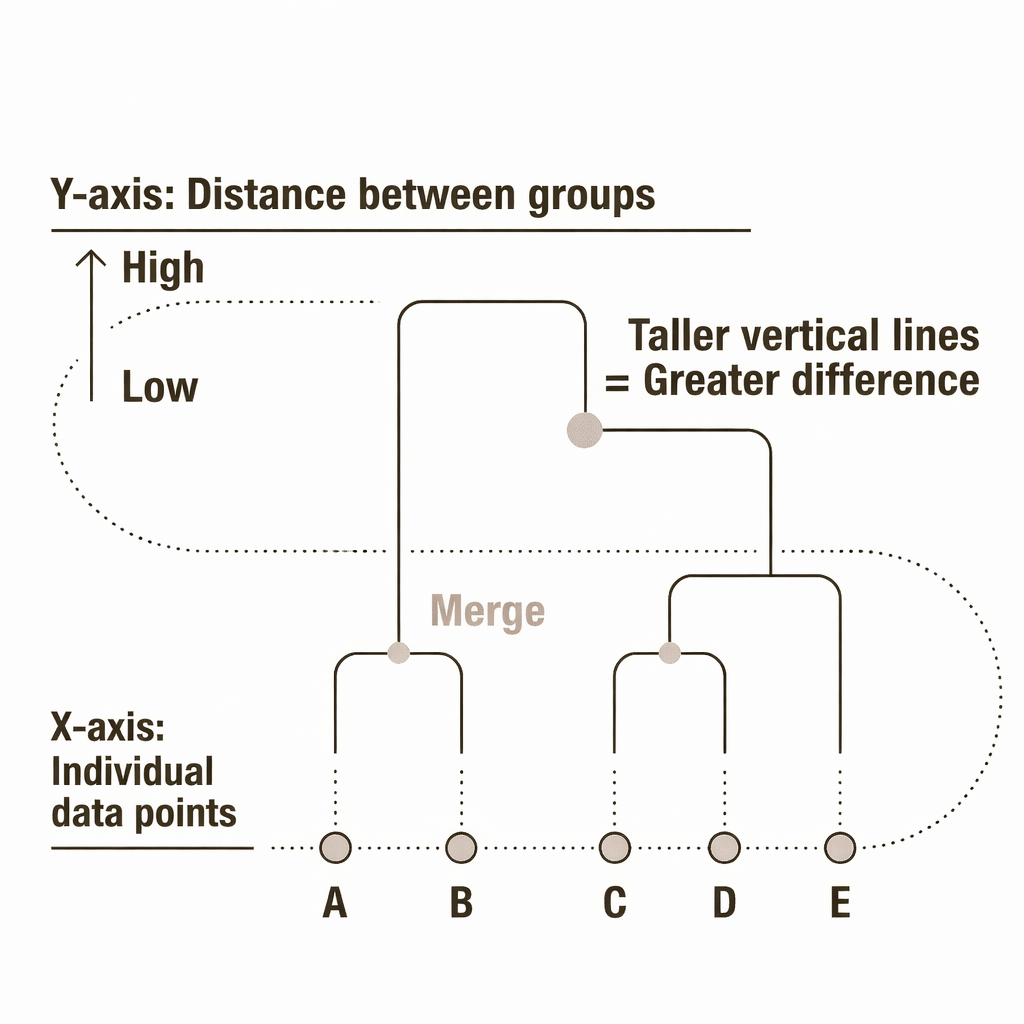
The Secret Weapon: The Dendrogram
A Dendrogram is a visual memory of every merge the algorithm made — not just the final result.
The Golden Rule :
The taller the vertical lines before a merge, the more different those two groups are.
Finding 'K': Slicing the Tree
Text
Summary
4
Ward’s method keeps clusters compact.
3
Cut the tree to find optimal clusters.
2
Dendrogram shows merge history and distances.
1
Bottom-up clustering (each point → one cluster → merge).
Quiz
What does dendrogram height represent?
A. Number of data points
B. Distance between clusters
C. Processing time
D. Accuracy
Quiz-Answer
What does dendrogram height represent?
A. Number of data points
B. Distance between clusters
C. Processing time
D. Accuracy
By Content ITV


